17 DevOps Metrics You Should Be Tracking
The development process requires a mix of technical
and communications skills, which calls for specialized metrics to keep track of
the team’s vitals.
Productivity in software development has always been tricky to measure. Unlike in other industries, the act of programming is not something that’s easy to parallelize. The development process is unique in that it requires a diverse mix of technical and communications skills, which calls for a set of specialized metrics to keep track of the team’s vitals.
The Pulse of Software Development
Not all metrics were created equal. Depending on the context, some are more useful than others. The things we choose to measure can help us find problems or obscure them behind irrelevant data and non-productive goals.
When it comes to deciding which metrics to keep track of, we should consider a few points.
1. People don't act the same when they feel observed. This is called the Hawthorne effect, and it can create undue pressure. It's best to keep the metrics non-personal and anonymous where possible.
2. The first point also means that metrics should only be used to track a team's progress over time and not to compare teams or individuals.
3. Putting too much emphasis on hitting an arbitrary number creates incentives to game the system. Dave Farley and Jez Humble had this to say on that subject:
"Measure the lines of code, and developers will write many short lines of code. Measure the number of defects fixed, and testers will log bugs that could be fixed by a quick discussion with a developer.”
— Continuous Delivery: Reliable Software Releases through Build, Test, and Deployment Automation
So, before choosing the metrics you want to use to follow your team's progress, everyone should know that their only purpose is to track progress and identify problems. They are not meant to commend or chastise individuals.
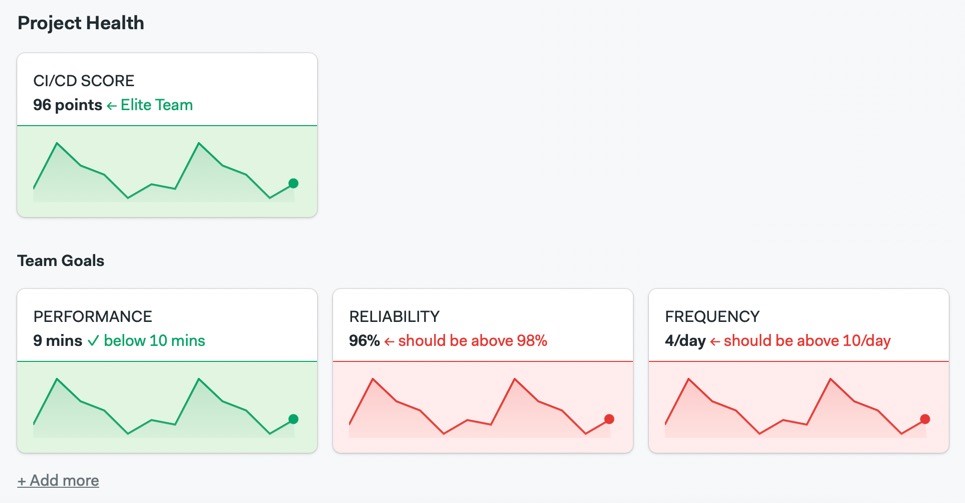
A dashboard with all the chosen metrics should be created and visible to everyone on the team.
Four DORA Metrics
DORA metrics is the principal tool that we have to measure software development. They consist of four benchmarks:
1. Deployment frequency (DF): how often an organization successfully releases a product to the users or deploys it to production.
2. Lead time to changes (LT): the amount of time it takes a commitment to reach production or release.
3. Mean time to restore service (MTTR): how long it takes an organization to recover from a failure in production.
4. Change failure rate (CFR): the percentage of releases or deployments that cause a failure in production.
Development teams can be ranked on one of four levels: Low, Medium, High, and Elite.
|
METRIC |
LOW |
MEDIUM |
HIGH |
ELITE |
|
DF |
fewer than 1 per 6 months |
1 per month to 1 per 6 months |
1 per week to 1 per month |
On demand (multiple deploys per day) |
|
LT |
more than 6 months |
1 month to 6 months |
1 day to 1 week |
Less than 1 hour |
|
MTTR |
more than 6 months |
1 day to 1 week |
Less than a day |
Less than 1 hour |
|
CFR |
16 to 30% |
16 to 30% |
16 to 30% |
0 to 15% |
Year after year, the DORA research team has proven that a high DORA score is a predictable indicator of high performance. As a result, they should be included in any measurement strategy involving software development.
Cycle Time
Along with DORA, cycle time is another principal indicator of productivity. It is defined as the average time between the moment we decide to add a feature and its deployment or release to the public or customer.
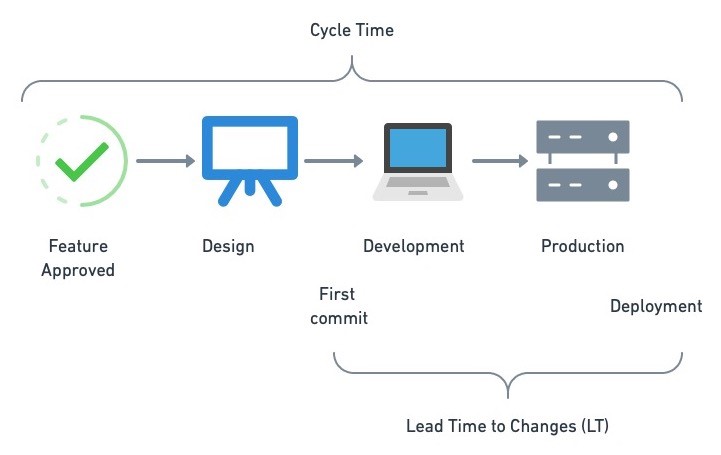
Cycle time spans the entirety
of feature development, from inception to reality. Lead time to changes begins
ticking when the first line of code for a feature is committed.
A fast cycle time means a team can consistently deliver features at a sustained rate.
Quality
Quality implies different things to different people. While some teams emphasize adhering to style rules, others might be more concerned with security risks or maintaining an enjoyable user experience. What matters is that the team is in agreement regarding what quality entails for them.
We can use a mix of parameters to estimate the quality of the code. That which does not meet a predetermined quality bar should cause the CI pipeline to fail. Some valuable indicators are:
- Number of vulnerabilities.
- Violation of style guidelines.
- Code coverage.
- Number of stale branches.
- Cyclomatic complexity.
- Broken architectural constraints. For instance, making sure that code in one module does not reference classes in another module.
Customer Feedback
Customer feedback can come in many forms, such as tickets opened, usage patterns, mentions on social media, and information gleaned from Net Promoter Score (NPS) surveys. The specifics vary depending on the business and product, but we must have the voice of the customer represented in some concrete form because, at the end of the day, they pay the bills.
Are users happy with the product?
Employee Satisfaction
Our users and customers are not the only ones whose well-being we must tend to. Developers, testers, quality and business analysts, product managers, and managers are crucial as well because we need them all to make a great product. The best ideas come from optimistic, confident, and well-rested minds.
Employee satisfaction is affected by various factors, which we should measure in some way:
- How comprehensive and updated is the documentation?
- How easy is it to onboard a new developer?
- Do employees feel their voices are heard?
- How is the work/life balance? Is anyone burning out?
- Is the workplace a safe environment to take chances and experiment?
- Do employees have the right tools to do their jobs?
- Do they feel they can offer constructive criticism safely?
Average CI Duration
Software development is an exercise in experimentation — we make small changes and see how they work out. The feedback from the CI pipeline ultimately determines if a change stays in the codebase.
Working in small increments becomes painful when the CI/CD process is slow because developers must either wait to see the results or move on and try to remember to return to the pipeline when the results are in. In either case, it is very difficult to keep up the creative flow.
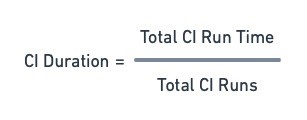
CI duration formula.
The CI pipeline's average duration should be measured in minutes. We should aim for at least ten minutes in order to keep developers engaged and the code flowing.
CI Runs Per Day
This is the number of CI pipeline executions per day. We want to keep this figure high — at least four or five runs per active developer — because it implies that developers trust and depend on the CI/CD process.
When the CI runs per day decreases, it might be caused by a slow or awkward-to-use CI/CD system.
CI Mean Time to Recovery (MTTR)
We can only test, release, or deploy when the build is working. In such cases, everyone should stop what they are doing and focus on restoring the build. Mean time to recovery measures how long, on average, it takes a team to fix a broken CI build. We're typically only concerned with the main branch when measuring this metric.
Long recovery times signal that we need to work on making the CI/CD process more robust. We must also ensure that the habit of prioritizing the fix of the CI build is ingrained in the team’s culture.
CI Test Failure Rate
Measures how often the CI pipeline fails due to a failed test. Tests are a safety net, so there’s nothing wrong with them failing. Nonetheless, developers should run the tests on their machines before committing to code. If the failure rate is too high, it might indicate that developers are finding it hard to run tests locally.
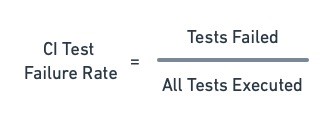
CI test failure rate formula.
CI Success Rate
The CI success rate is the number of successful CI runs divided by the total number of runs. A low success rate indicates that the CI/CD process is brittle, needs more maintenance, or that developers are merging untested code too often.
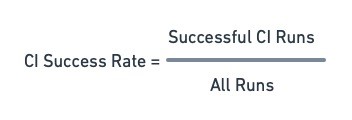
CI success rate.
Flakiness
Flakiness indicates how brittle the CI pipeline is. A flaky build fails or succeeds randomly for no apparent reason. Flakiness is caused by flaky tests or an unreliable CI/CD platform. Flaky tests negatively impact CI run time, success rate, and time to recovery.
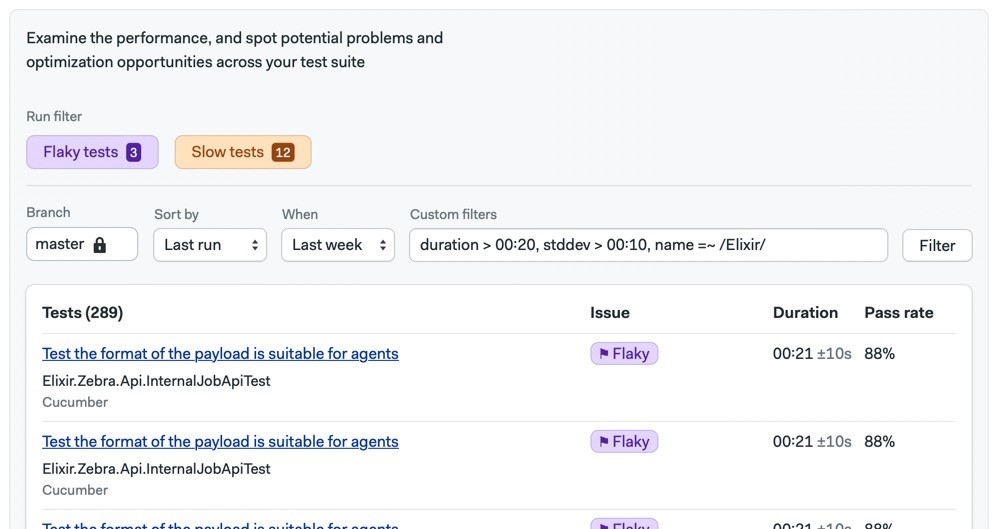
The Test Summary tab shows flaky and slow tests.
Coverage
Code coverage is the percentage of code that is covered by the test suite. This is a bit controversial since it is a metric that has been known to be frequently misused. For example, requiring 100% coverage does not raise quality — on the contrary, it leads to unnecessary testing of trivial code.
Like anything else, coverage is useful when used in moderation. For instance, a project with 5% coverage is undoubtedly under-tested to the point that the outcomes of the tests aren’t showing us much.
Defect Escape Ratio
Measures the number of errors that were not detected by the CI/CD process. A high value means that testing is inadequate. In this case, we should check the coverage value and then re-evaluate how the test suite is structured. We might need more kinds of tests in our test suite.
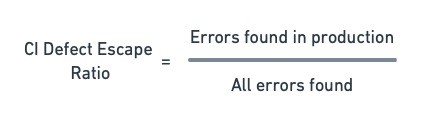
Defect Escape Ratio.
Uptime
Uptime is the percentage of time the application is available. The higher it is, the less outage there were in a specific period. For example, a 99.9% uptime amounts to eight hours and 45 minutes of downtime per year. This operational metric should always be part of our measurements as we risk losing customers every time the site or application is down.
A low uptime value points to problems in the infrastructure, the code, and/or the deployment process.
|
UPTIME |
TOTAL YEARLY DOWNTIME |
|
99.9 % |
8h 45m 56s |
|
99.99 % |
52m 35s |
|
99.999 % |
5m 15s |
|
99.9999 % |
31s |
Service Level Indicator
Businesses signing service level agreements (SLAs) must pay attention to uptime in order to avoid fines or other penalties. The service level indicator (SLI) contrasts actual application performance or uptime with predetermined standards.
Even when SLAs are not in effect, a company can establish an internal service level objective (SLO) which accomplishes the same function.
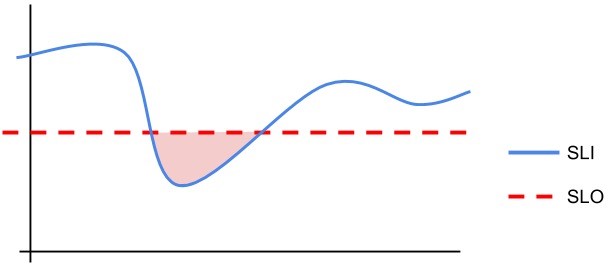
SLI shows reality versus SLA
or SLO.
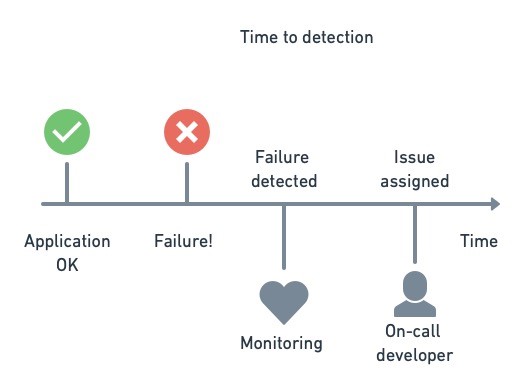
Mean Time to Detection
This is the average time a problem persisted in production before it was detected and assigned to the appropriate team. We can measure it as the time since the problem began until an issue or ticket was raised. Mean time to detection directly correlates to how comprehensive monitoring is and how effective notifications are.
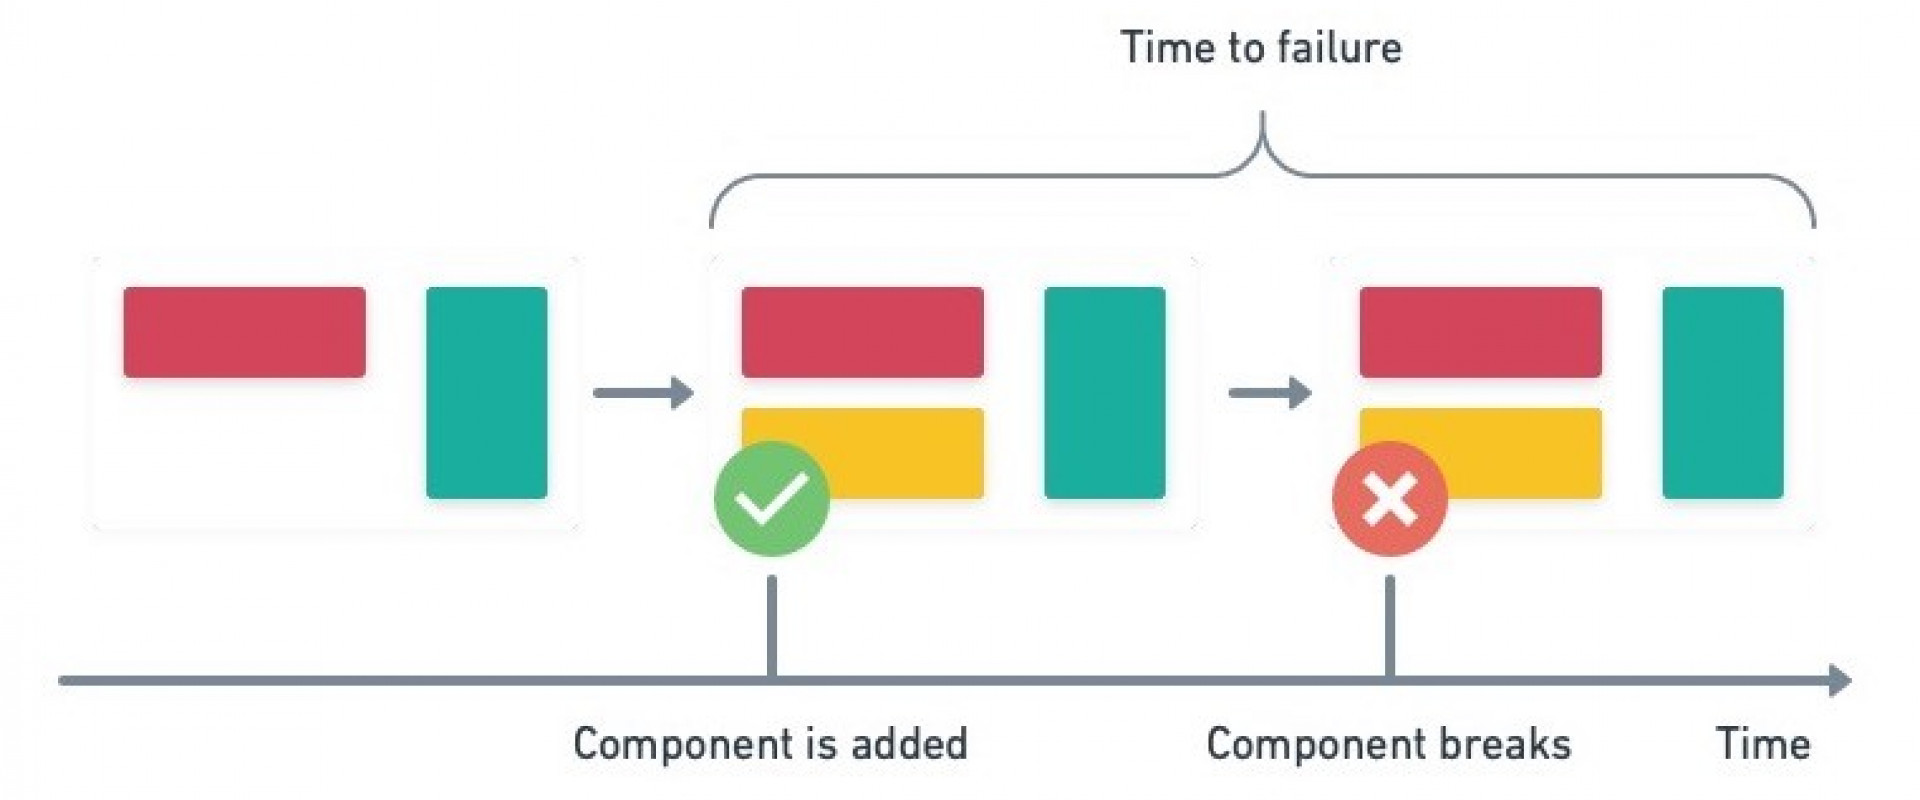
Mean Time Between Failures
Measures how often a system or subsystem fails on average. It’s a metric suitable for measuring the stability of the application’s subcomponents. It can help us determine which parts require refactoring.
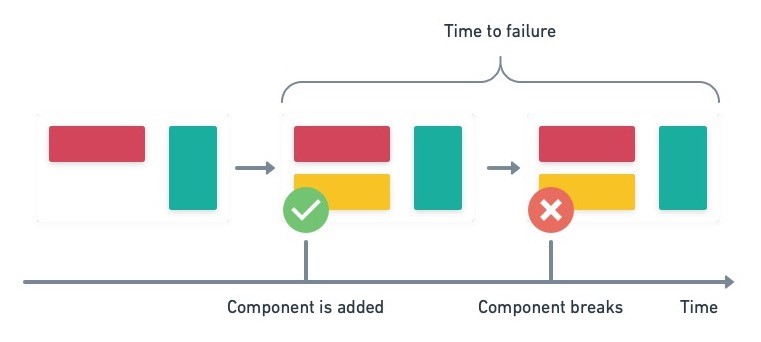
The time between failures.
Metrics Just Measure Symptoms
Metrics are the vital signs of your project. A poor metric is a symptom, not a disease. They point out the presence of a problem but do not say anything definite about the underlying cause. While it might be tempting to fix a problem by “managing” the variables underneath a metric, doing so is akin to self-medicating — it only succeeds in hiding the symptom. Like any good doctor, a good engineer investigates, proposes solutions, and confirms their effectiveness by checking to see if the metric has improved.
Thanks for reading, and happy measuring!
We ZippyOPS, Provide consulting, implementation, and management services on DevOps, DevSecOps, Cloud, Automated Ops, Microservices, Infrastructure, and Security
Services offered by us: https://www.zippyops.com/services
Our Products: https://www.zippyops.com/products
Our Solutions: https://www.zippyops.com/solutions
For Demo, videos check out YouTube Playlist: https://www.youtube.com/watch?v=4FYvPooN_Tg&list=PLCJ3JpanNyCfXlHahZhYgJH9-rV6ouPro
Recent Comments
No comments
Leave a Comment
We will be happy to hear what you think about this post