A Deep Dive Into Distributed Tracing
Dive deep into components of distributed traces, why to use distributed tracing, considerations for implementing, and popular tools in the market today.
Distributed tracing, as the name suggests, is a method of tracking requests as it flows through distributed applications. Along with logs and metrics, distributed tracing makes up the three pillars of observability. While all three signals are important to determine the health of the overall system, distributed tracing has seen significant growth and adoption in recent years.
That's because traces are a powerful diagnostic tool to paint how requests propagate between services and uncover issues along the boundaries. As the number of microservices grows, the complexity in observing the entire lifespan of requests inevitably increases as well. Logs and metrics can certainly help with debugging issues stemming from a single service, but distributed tracing will tie contextual information from all the services and surface the underlying issue.
Instrumenting for observability is an ongoing challenge for any enterprise as the software landscape continues to evolve. Fortunately, distributed tracing provides the visibility companies need to operate in a growing microservice ecosystem. In this article, we'll dive deep into the components of distributed traces, reasons to use distributed tracing, considerations for implementing it, as well as an overview of the popular tools in the market today.
Components of Distributed Tracing
Distributed tracing breaks down into the following components:
- Spans – smallest unit of work captured in observing a request (e.g., API call, database query)
- Traces – a collection of one or more spans
-
Tags
– metadata associated with a span (e.g.,
userId,resourceName)
To illustrate, let's walk through a distributed tracing scenario for a system with a front end, simple web server, and a database. Tracing begins when a request is initiated (e.g., clicking a button, submitting a form, etc.). This creates a new trace with a unique ID and the top-level span. As the request propagates to a new service, a child span is created. In our example, this would happen as the request hits the web server and when a query to the database is made. At each step, various metadata is also logged and tied to the span as well as the top-level trace.
Once all the work is complete for the corresponding request, all of the spans are aggregated with associated tags to assemble the trace. This provides a view of the system, following the lifecycle of a request. This aggregated data is usually presented as a flame graph with nested spans over time.
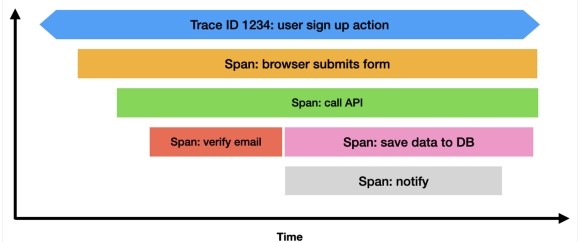
Figure 1: Flame graph of traces
Visualizing traces this way helps to reveal performance bottlenecks (i.e., longest span in the trace) as well as map out each interaction with the microservices.
Why Use Distributed Tracing
For legacy applications largely running in a monolithic manner, logs and metrics were often sufficient for observability. Detailed logging provides a point-in-time snapshot of that service, leaving a record of all the code execution. Metrics gather statistical information about the system and expose the general health of that service. For monolithic applications, combining the two provided the necessary visibility.
However, in a microservices world, problems can occur not just inside a single application (which logs and metrics can reveal), but also at the boundaries of those services. To respond to an incident or to debug a performance degradation, it's important to understand how the requests are flowing through one service to another.
With that in mind, the benefits of distributed tracing include:
- Visualizing service relationships – By inspecting the spans within a trace from the flame graph, developers can map out all the service calls and their request flow. This helps to paint a global picture of the system, providing contextual data to identify bottlenecks or ramifications from design changes.
- Pinpointing issues faster – When the engineer on-call is paged from an incident, traces can quickly surface the issue and lead to reduced mean time to detect (MTTD) and repair (MTTR). This is a big win for the developer experience while maintaining SLA commitments.
- Isolating specific requests – Since traces document the entire lifecycle of a request, this information can be used to isolate specific actions such as user behavior or business logic to investigate.
Despite these benefits, adoption numbers for distributed tracing pale in comparison to logging and metrics as distributed tracing comes with its fair share of challenges. First off, distributed tracing is only useful for the components that it touches. Some tracing tools or frameworks don't support automatic injection or some languages (especially front-end components). This would result in missing data and added work to piece together the details. Also, depending on the application, tracing can generate a significant amount of data. Dealing with the scale and surfacing the important signals can be a challenge.
Considerations for Implementation
To maximize the benefits from distributed tracing, several factors must be considered:
- Automatic instrumentation – Most modern tracing tools support automatic injection of tracing capabilities without significant modifications to the underlying codebase. Some languages or frameworks may not be fully supported in some cases but opt for using automated tooling instead of wasting valuable developer time.
- Scalable data capture – To deal with massive amounts of tracing data, some tools opt to downsample, which may result in missing or unrepresentative data. Choose tools that can handle the volume and intelligently surface important signals.
- Integrations – Traces are one part of the observability stack. Traces will be more useful if they can be easily tied to existing logs or metrics for a comprehensive overview. The goal should be to leverage the power of tracing, alongside other signals, to get to actionable insights and proactive solutions rather than collect data for retroactive analysis only.
Popular Tools
The original infrastructure for supporting internet-scale distributed tracing can be attributed to Dapper, Google's internal tool announced in 2010. Since then, there's been a proliferation of both open-source and enterprise-grade SaaS tools in the market.
Open-Source Tools
The open-source ecosystem for distributed tracing is fairly mature with a lot of the projects backed by large tech companies. Each tool listed below supports most programming languages and flexible deployment options:
- Zipkin – one of the oldest and popular tools open-sourced by Twitter
- Jaeger – a Cloud Native Computing Foundation (CNCF) project donated by Uber that builds on ideas from Dapper and Zipkin
- OpenTelemetry – an industry-leading observability framework developed by the CNCF that aims to standardize how to instrument and export telemetry data, including traces
Commercial Tools
If enterprise-grade support is required, commercial tools from hyperscalers and observability platforms are also readily available. The benefit of choosing a commercial tool would be easier integrations with existing tooling and infrastructure. For example, hyperscalers such as AWS and Google provide their own flavor of tracing solutions such as AWS X-Ray and Cloud Trace.
Conclusion
Distributed tracing, when implemented properly with logs and metrics, can provide tremendous value in surfacing how requests move in a complex, microservices-based system. Traces uncover performance bottlenecks and errors as requests bounce from one service to another, mapping out a global view of the application. As the number of services grows alongside the complexity that follows with it, a good distributed tracing system will become a necessity for any organization looking to upgrade their observability platform.
While implementing tracing requires some planning, with a growing number of robust open-source and commercial tools available, organizations can now easily adopt tracing without a significant engineering overhaul. Invest in a good distributed tracing infrastructure to reduce MTTD/MTTR and improve the developer experience at your organization.
We ZippyOPS, Provide consulting, implementation, and management services on DevOps, DevSecOps, Cloud, Automated Ops, Microservices, Infrastructure, and Security
Services offered by us: https://www.zippyops.com/services
Our Products: https://www.zippyops.com/products
Our Solutions: https://www.zippyops.com/solutions
For Demo, videos check out YouTube Playlist: https://www.youtube.com/watch?v=4FYvPooN_Tg&list=PLCJ3JpanNyCfXlHahZhYgJH9-rV6ouPro
Relevant Blogs:
Secure Kubernetes With Kubescape
5 Kubernetes Lens Alternatives
Recent Comments
No comments
Leave a Comment
We will be happy to hear what you think about this post