An Overview of Popular Open-Source Kubernetes Tools
This article explains open-source Kubernetes tools used for development, monitoring, and deployment purposes that can improve your cloud-native experience.
Kubernetes is the industry-standard technology used by enterprises to deliver microservices-based container orchestration platforms. The Kubernetes ecosystem is growing rapidly and has a vibrant community that has built several free open-source tools and extensions to make it easier to run your workloads. This article will explain some of the more popular open-source Kubernetes tools used for development, monitoring, and deployment purposes that can improve your cloud-native experience.
Kubernetes CLI Tool: kubectl
Kubectl is the command-line
tool that enables you to run commands against your Kubernetes cluster. You can
refer to the kubectl installation
document to install the tool on any operating system, including
Windows, Linux, or macOS. Once installed, you can inspect and manage the
cluster by running various command-line operations to create new cluster
resources, view the details, and delete resources as required. Please refer to
the kubectl
cheat sheet here that contains the most used Kubernetes commands.
Minikube: Running Kubernetes Locally
If you want to get started with Kubernetes and run a cluster
locally on your machine for application development or training, Minikube is
the easiest way. Minikube runs a single-node Kubernetes cluster and lets you
interact with the cluster by writing kubectl commands. Installing
Minikube is straightforward, and it greatly simplifies the
developer experience. You can also monitor your Kubernetes cluster via the
browser and visually interpret the cluster state by accessing the Kubernetes
dashboard from Minikube. The table below lists some common Minikube
commands:
|
COMMAND |
DEFINITION |
|
|
Check if Minikube is running |
|
|
Start the Kubernetes cluster |
|
|
Stop the Kubernetes cluster |
|
|
Open the Kubernetes dashboard in the browser |
|
|
Delete the Minikube VM |
Kubernetes Extensions for Visual Studio Code
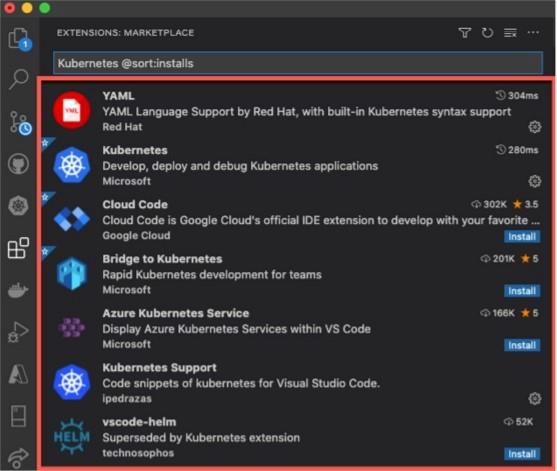
VS Code is one of the most popular open-source IDEs and provides numerous features to improve the cloud-native development experience. VS Code also offers many extensions that assist in developing apps in Kubernetes environments. The VS Code extensions for Kubernetes simplify microservice development and help interact with Kubernetes clusters, irrespective of where they get deployed — AWS, Azure, GCP, on-premises, etc.
The Kubernetes extension lets you connect to the clusters and drill down into workloads, services, nodes, and pods. You also can modify the manifest files for resources, install Helm charts, and apply them to the cluster right from the IDE. The YAML plugin provides autocomplete, error detection, formatting, a document outlining, and syntax validation functionalities in Kubernetes YAML definitions. The Kubernetes Support plugin includes code snippets to create resources like pods, services, and deployments quickly. Developers can leverage similar extensions available in the marketplace that can increase their productivity by automating repetitive actions.
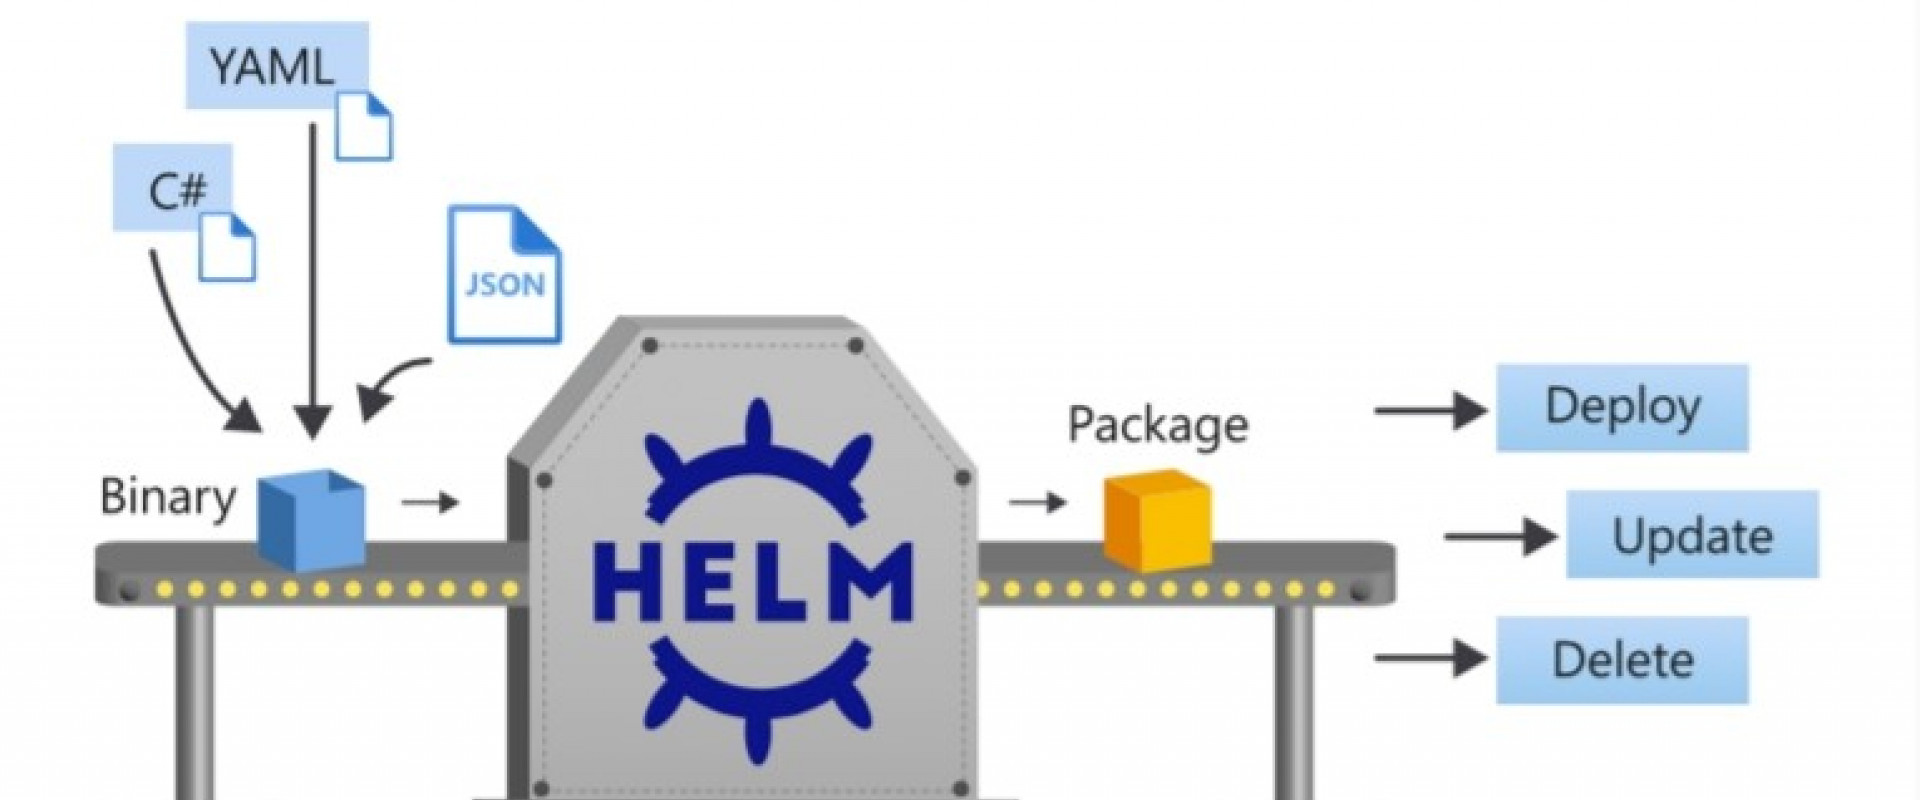
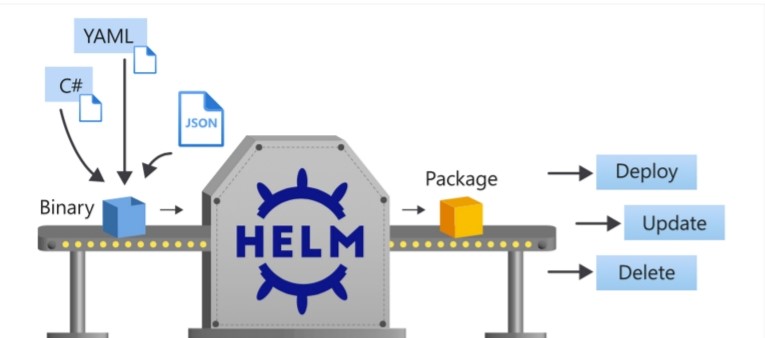
Helm: K8s Package Manager for Repeatable Deployments
Helm is an open-source package manager that reduces the complexity of deploying cloud-native applications on Kubernetes and makes releases repeatable and reliable. Helm Charts are pre-configured Kubernetes resources, applications, or bundles of YAML configuration files that can be templatized and reused across different environments. Developers can use Helm to configure, package, and deploy applications to Kubernetes clusters for complex business processes. There is no need to hardcode configurations when deploying your applications to multiple environments. Many Helm Charts are publicly available in Helm repositories and are a great way to promote the reusability of charts. You can install several Helm Charts on your Kubernetes cluster — like Prometheus, Istio, Jaeger, Fluentd, Jenkins, ArgoCD, and more.
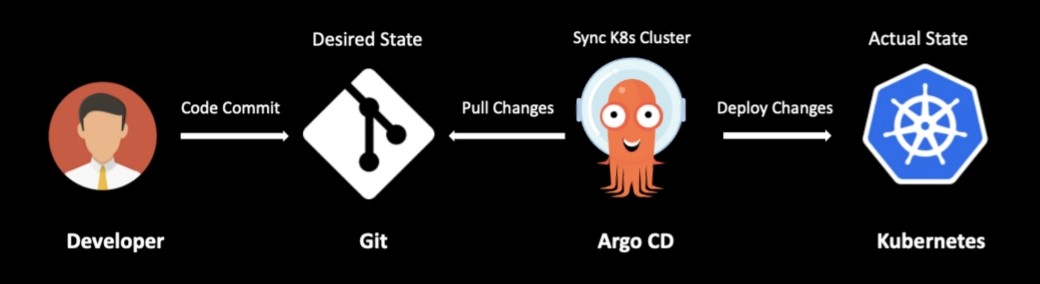
Argo CD: Declarative GitOps Continuous Delivery Tool
Argo CD is a declarative GitOps tool to deploy your applications seamlessly to Kubernetes. Argo CD allows you to automatically synchronize the Kubernetes cluster state with the desired state stored in Git. Behind the scenes, Argo CD runs as a controller within the Kubernetes cluster, watches for changes to the Git repository, compares it against the resources deployed in the cluster, and synchronizes state. The GitOps process increases the productivity of the developers since they don't have to deal with the deployment of their codebase into the cluster and make manual changes to the underlying infrastructure.
Argo CD provides an interactive user dashboard that displays details about the services and resources deployed in the Kubernetes cluster. It helps you visualize the health of the applications deployed into the cluster and provides automated and manual sync to the desired state. Argo CD automatically detects configuration drift issues and marks the deployment as out of sync. You can manually trigger the sync process or use the auto-sync functionality in Argo CD to sync when it detects configuration changes.
Prometheus: Kubernetes Monitoring at Scale
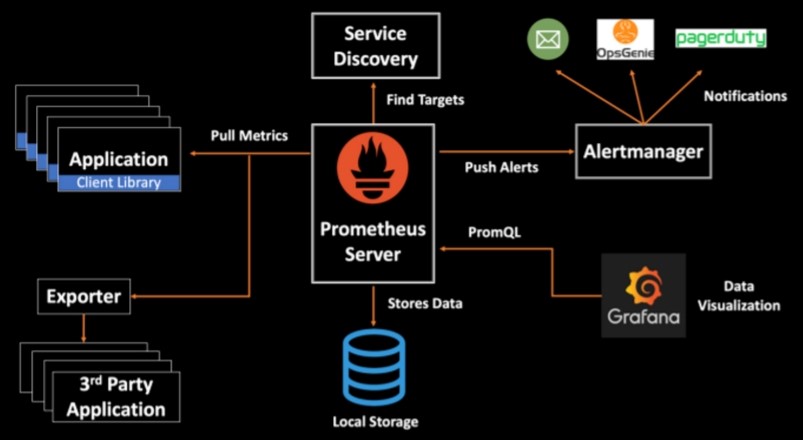
Prometheus is the leading open-source, metrics-based Kubernetes monitoring tool. It has a powerful query language (PromQL) with a multidimensional data model that stores time-series data. Prometheus is a pull-based monitoring system that scrapes real-time metrics from the applications running in a Kubernetes cluster using exporters. These metrics get stored in local storage that can be queried using PromQL or viewed via Grafana dashboards. You can also configure the Alertmanager to handle the alerting strategy and send intelligent alerts to different notification systems like OpsGenie, Pagerduty, email, etc.
Grafana: Observability and Dashboards
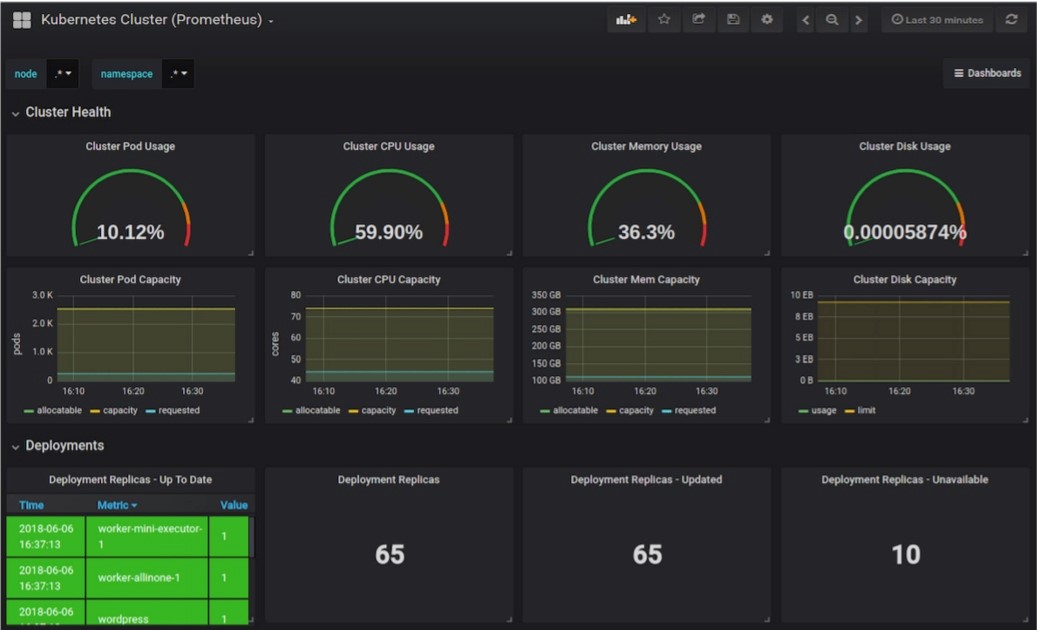
Grafana is the most popular data visualization and analytics tool that helps you understand complex time-series data. Grafana allows you to query, visualize, and alert on metrics stored in different data stores, such as Prometheus, Elasticsearch, InfluxDB, MySQL, PostgreSQL, AWS Cloudwatch, Azure Monitor, Graphite, etc. In addition, apart from creating custom monitoring dashboards, you can leverage the official and community-built open-source dashboards for monitoring Kubernetes clusters. From a Kubernetes monitoring perspective, you can have dashboards to display real-time CPU and memory utilization metrics for your cluster, nodes, and pods.
For troubleshooting issues, you should have metrics showing container restarts, throttled or unhealthy pods, resource requests, and limits in your dashboards.
Istio: Service Mesh
A service mesh design pattern simplifies the management of running a distributed microservices architecture. A service mesh is an infrastructure layer that handles service-to-service communication. It provides functionalities like traffic management, authentication, security, load balancing, service discovery, telemetry, fault injection, and circuit breaking without any application changes. The sidecar design pattern handles this complexity by deploying a sidecar proxy alongside your services. All traffic to your services goes through the proxy.
Envoy from Lyft is one of the most popular open-source proxies designed for cloud-native applications. Envoy runs alongside every service and provides the necessary features in a platform-agnostic manner. Istio is a popular service mesh framework that uses Lyft’s Envoy as the sidecar proxy by default.
With Kubernetes deployments growing in size and complexity, it is becoming increasingly difficult to manage service functionalities. Istio comes to the rescue here by shifting this complexity from the application to the infrastructure layer. Istio, Envoy, and Kubernetes generally work together to operate a distributed microservice-based workload at scale.
Kiali: Service Mesh Observability
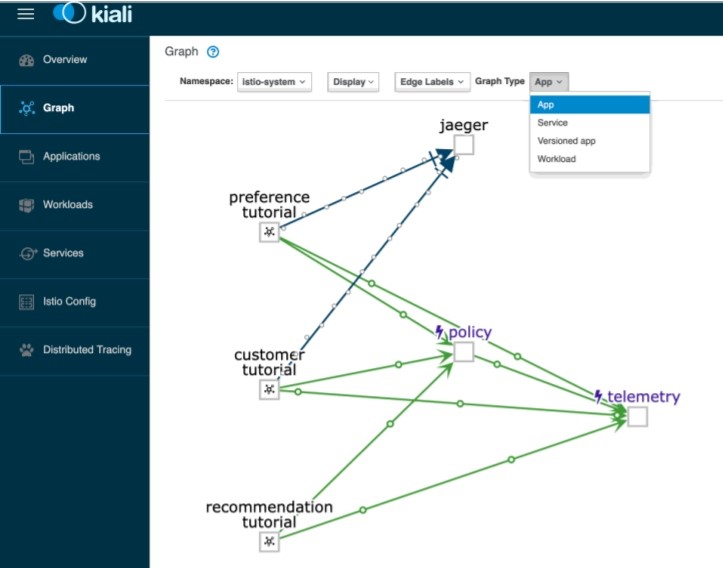
When you have microservices running in a Kubernetes environment and leveraging a service mesh, it becomes critical to have a strategy to monitor, visualize, and have complete visibility into your mesh. Kiali is a management console for Istio that provides in-depth observability into the service mesh topology. Kiali also displays the real-time traffic patterns within your mesh, shows the connectivity between microservices, and helps evaluate the health of the services running inside the cluster. Like Grafana, Kiali uses the metrics data stored in Prometheus and displays them in the console.
Conclusion
With the rise of distributed computing and container orchestration technologies, many Kubernetes tools are available to simplify your experience building and managing cloud-native applications. Selecting the right tool for your infrastructure that fits your architecture and business use case is critical. I encourage you to read through the open-source tools I have provided in this article and keep yourself up to date with the evolving community in the cloud-native space.
Relevant blogs:
Recent Comments
No comments
Leave a Comment
We will be happy to hear what you think about this post