Configure Kubernetes Health Checks
In this article, readers will learn how to configure Kubernetes health checks, which includes background info, types of probes, implementation, and more.
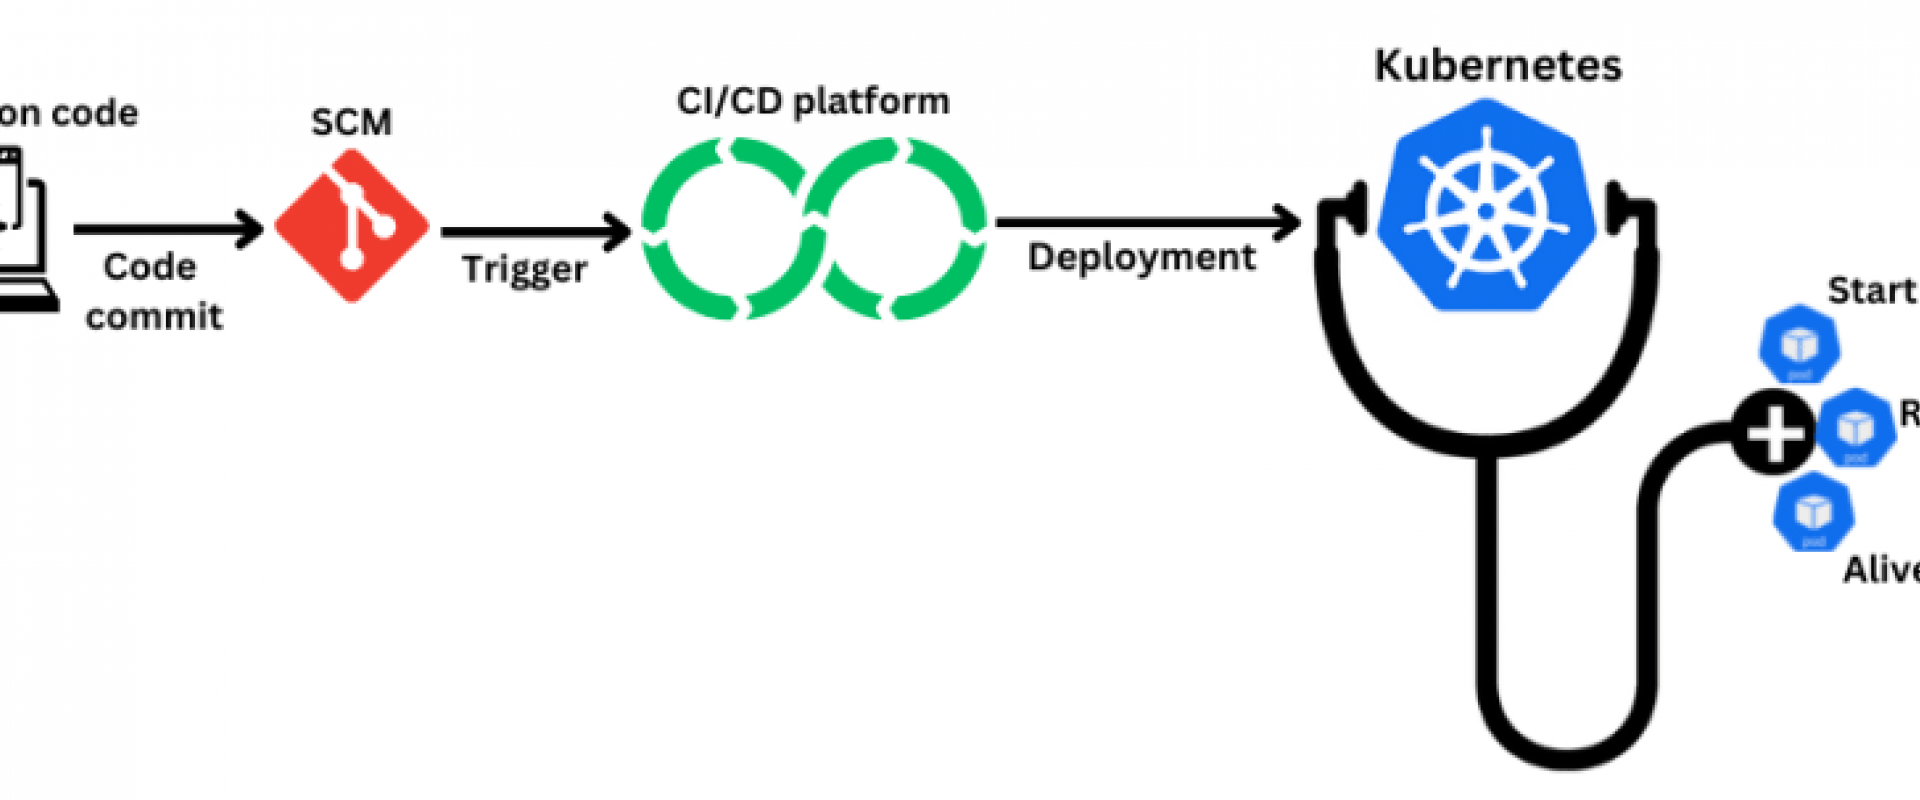
Kubernetes is an open-source container orchestration platform that helps manage and deploy applications in a cloud environment. It is used to automate the deployment, scaling, and management of containerized applications. It is an efficient way to manage application health with Kubernetes probes. This article will discuss Kubernetes probes, the different types available, and how to implement them in your Kubernetes environment.
What Are Kubernetes Probes?
Kubernetes probes are health checks that are used to monitor the health of applications and services in a Kubernetes cluster. They are used to detect any potential problems with applications or services and identify potential resource bottlenecks. Probes are configured to run at regular intervals and send a signal to the Kubernetes control plane if they detect any issues with the application or service.
Kubernetes probes are typically implemented using the Kubernetes API, which allows them to query the application or service for information. This information can then be used to determine the application’s or service’s health. Kubernetes probes can also be used to detect changes in the application or service and send a notification to the Kubernetes control plane, which can then take corrective action. Kubernetes probes are an important part of the Kubernetes platform, as they help ensure applications and services run smoothly. They can be used to detect potential problems before they become serious, allowing you to take corrective action quickly.
A successful message for a readiness probe indicates the container is ready to receive traffic. If a readiness probe is successful, the container is considered ready and can begin receiving requests from other containers, services, or external clients.
A successful message for a liveness probe indicates the container is still running and functioning properly. If a liveness probe succeeds, the container is considered alive and healthy. If a liveness probe fails, the container is considered to be in a failed state, and Kubernetes will attempt to restart the container to restore its functionality. Both readiness and liveness probes return a successful message with an HTTP response code of 200-399 or a TCP socket connection is successful. If the probe fails, it will return a non-2xx HTTP response code or a failed TCP connection, indicating that the container is not ready or alive.
A successful message for a Kubernetes probe indicates the container is ready to receive traffic or is still running and functioning properly, depending on the probe type.
Types of Kubernetes Probes
There are three types of probes:
1. Startup probes
2. Readiness probes
3. Liveness probes
1. Startup Probes
A startup probe is used to determine if a container has started successfully. This type of probe is typically used for applications that take longer to start up, or for containers that perform initialization tasks before they become ready to receive traffic. The startup probe is run only once, after the container has been created, and it will delay the start of the readiness and liveness probes until it succeeds. If the startup probe fails, the container is considered to have failed to start and Kubernetes will attempt to restart the container.
2. Readiness Probes
A readiness probe is used to determine if a container is ready to receive traffic. This type of probe is used to ensure a container is fully up and running and can accept incoming connections before it is added to the service load balancer. A readiness probe can be used to check the availability of an application’s dependencies or perform any other check that indicates the container is ready to serve traffic. If the readiness probe fails, the container is removed from the service load balancer until the probe succeeds again.
3. Liveness Probes
A liveness probe is used to determine if a container is still running and functioning properly. This type of probe is used to detect and recover from container crashes or hang-ups. A liveness probe can be used to check the responsiveness of an application or perform any other check that indicates the container is still alive and healthy. If the liveness probe fails, Kubernetes will attempt to restart the container to restore its functionality.
Each type of probe has its own configuration options, such as the endpoint to check, the probe interval, and the success and failure thresholds. By using these probes, Kubernetes can ensure containers are running and healthy and can take appropriate action if a container fails to respond.
How To Implement Kubernetes Probes
Kubernetes probes can be implemented in a few different ways:
- The first way is to use the Kubernetes API to query the application or service for information. This information can then be used to determine the application’s or service’s health.
- The second way is to use the HTTP protocol to send a request to the application or service. This request can be used to detect if an application or service is responsive, or if it is taking too long to respond.
- The third way is to use custom probes to detect specific conditions in an application or service. Custom probes can be used to detect things such as resource usage, slow responses, or changes in the application or service.
Once you have decided which type of probe you will be using, you can then configure the probe using the Kubernetes API. You can specify the frequency of the probe, the type of probe, and the parameters of the probe. Once the probe is configured, you can deploy it to the Kubernetes cluster.
Today, I’ll show how to configure health checks to your application deployed on Kubernetes with HTTP protocol to check whether the application is ready, live, and starting as per our requirements.
Prerequisites
- A Kubernetes cluster from any cloud provider. You can even use Minikube or Kind to create a single-node cluster.
- Docker Desktop to containerize the application.
- Docker Hub to push the container image to the Docker registry.
- Node.js installed, as we will use a sample Node.js application.
Tutorial
- Fork the sample application here.
- Get into the main application folder with the command:
cd Kubernetes-Probes-Tutorial- Install the dependencies with the command:
npm install- Run the application locally using the command:
node app.js
You should see the application running on port 3000.
In the application folder, you should see the Dockerfile with the following code content:
# Use an existing node image as base imageFROM node:14-alpine # Set the working directory in the containerWORKDIR /app # Copy package.json and package-lock.json to the containerCOPY package*.json ./ # Install required packagesRUN npm install # Copy all files to the containerCOPY . . # Expose port 3000EXPOSE 3000 # Start the applicationCMD [ "npm", "start" ]
This Dockerfile is to create a container image of our application and push it to the Docker Hub.
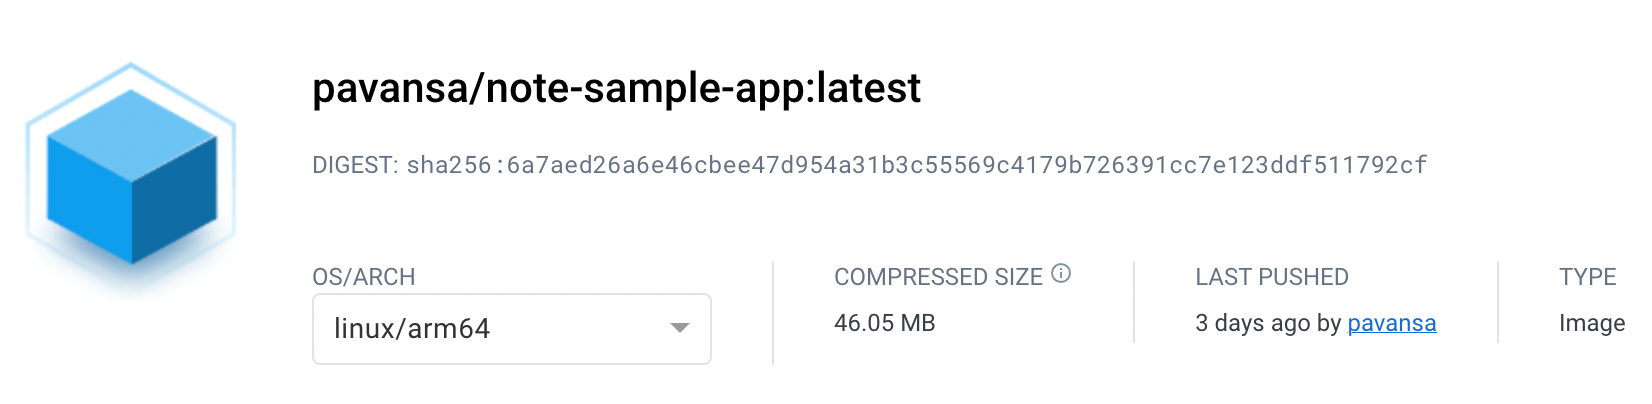
Next, build and push your image to the Docker Hub using the following command:
docker buildx build --platform=linux/arm64 --platform=linux/amd64 -t docker.io/Docker Hub username/image name:tag --push -f ./Dockerfile .
You can see the pushed image on your Docker Hub account under repositories.
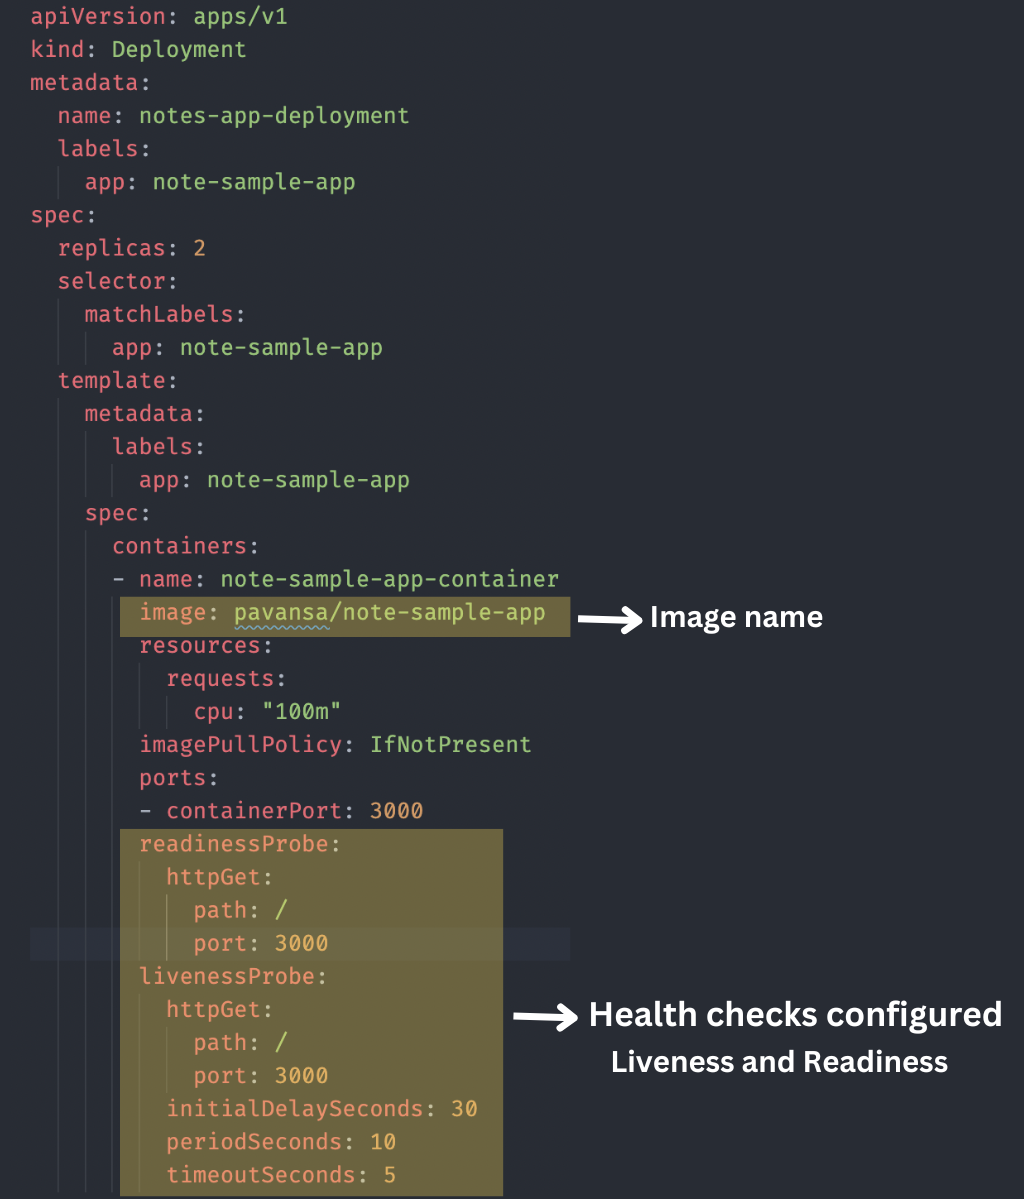
Next, deploy the manifest files. In the application folder, you
will notice a deployment.yaml file
with health checks/probes included, such as readiness and liveness probes.
Note: we have used our pushed image name in the YAML file:
apiVersion: apps/v1kind: Deploymentmetadata: name: notes-app-deployment labels: app: note-sample-appspec: replicas: 2 selector: matchLabels: app: note-sample-app template: metadata: labels: app: note-sample-app spec: containers: - name: note-sample-app-container image: pavansa/note-sample-app resources: requests: cpu: "100m" imagePullPolicy: IfNotPresent ports: - containerPort: 3000 readinessProbe: httpGet: path: / port: 3000 livenessProbe: httpGet: path: / port: 3000 initialDelaySeconds: 30 periodSeconds: 10 timeoutSeconds: 5
You can see the image used and the health checks configured in the above YAML file.
We are all set with our YAML file. Assuming you have a running cluster ready, let’s deploy the above mentioned manifest file with the command:
kubectl apply -f deployment.yaml
You should see the successful deployment of the file: “deployment.apps/notes-app-deployment created.”
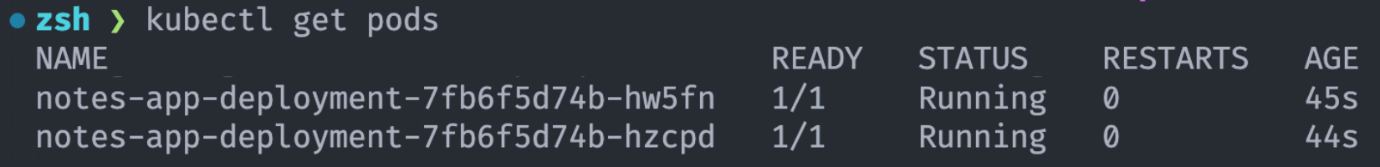
Let’s check the pod status with the following command to make sure the pods are running:
kubectl get pods
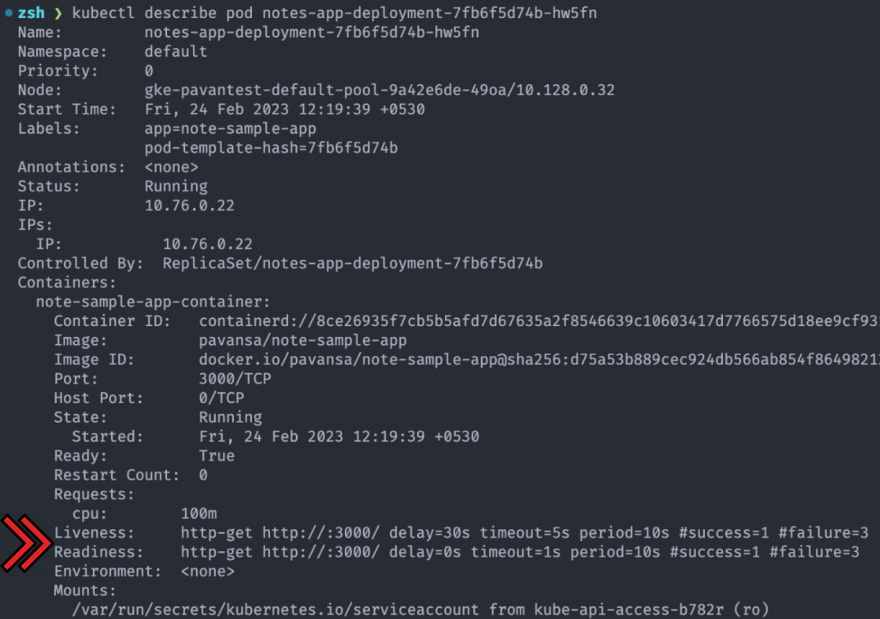
Let’s describe a pod using the following command:
kubectl describe pod notes-app-deployment-7fb6f5d74b-hw5fn
You can see the “Liveness and Readiness” status when you describe the pods.
Next, let’s check the events section.
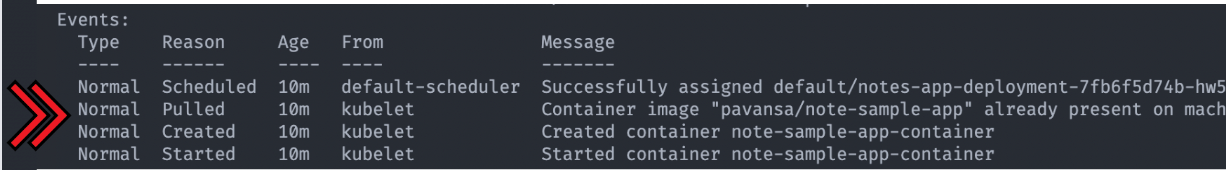
You can see the different events, such as “scheduled,” “pulled,” “created,” and “started.” All the pod events were successful.
Conclusion
Kubernetes probes are an important part of the Kubernetes platform, as they help ensure applications and services run smoothly. They can be used to detect potential problems before they become serious, allowing you to take corrective action quickly.
Kubernetes probes come in two types:
1. Liveness probes
2. Readiness probes
Along with custom probes that can be used to detect specific conditions in an application or service. Implementing Kubernetes probes is a straightforward process that can be done using the Kubernetes API.
If you are looking for a way to ensure the health of your applications and services, Kubernetes probes are the way to go. So, make sure to implement Kubernetes probes in your Kubernetes environment today!
We Provide consulting, implementation, and management services on DevOps, DevSecOps, Cloud, Automated Ops, Microservices, Infrastructure, and Security
Services offered by us: https://www.zippyops.com/services
Our Products: https://www.zippyops.com/products
Our Solutions: https://www.zippyops.com/solutions
For Demo, videos check out YouTube Playlist: https://www.youtube.com/watch?v=4FYvPooN_Tg&list=PLCJ3JpanNyCfXlHahZhYgJH9-rV6ouPro
If this seems interesting, please email us at [email protected] for a call.
Relevant Blogs:
15 Best Practices on API Security for Developers
How to Choose the Right Data Masking Tool for Your Organization
Keep Your Application Secrets Secret
How SecDevOps Adoption Can Help Save Costs in Software Development
Recent Comments
No comments
Leave a Comment
We will be happy to hear what you think about this post