Observability for Monitoring Microservices: Top 5 Tools
Knowing what's running inside the container, and how the application and code are performing is critical for tackling important issues.
With microservices architecture becoming the de facto standard for web applications now, effective debugging and anomaly detection calls for a system that is observable — which means, the internal state of an application can be inferred by observing and tracking the metrics, traces, and logs.
Observability is all about data exposure and easy access to information required to find issues when the communications fail, internal events do not occur as expected or events occur when they shouldn’t. Here, you’ll learn and know about different microservices monitoring tools and how to monitor microservices. Let’s take a look!
Monitoring microservices using a predefined set of metrics and logs helps in understanding the actual health status of applications. The way how services interact with each other at runtime needs to be monitored, managed, and controlled for identifying issues within the app.
Microservices Observability and monitoring microservices are crucial for understanding how apps are functioning and for identifying issues to prevent failures in advance. How to monitor microservices has become a common issue for enterprises these days.
Here is an overview of the approach that some of the platforms are taking to provide the engineering teams with complete observability for monitoring app performance and gauging its health status. Also, discussed here is a list of some popular microservices monitoring tools to know the insights and performance of the microservices.
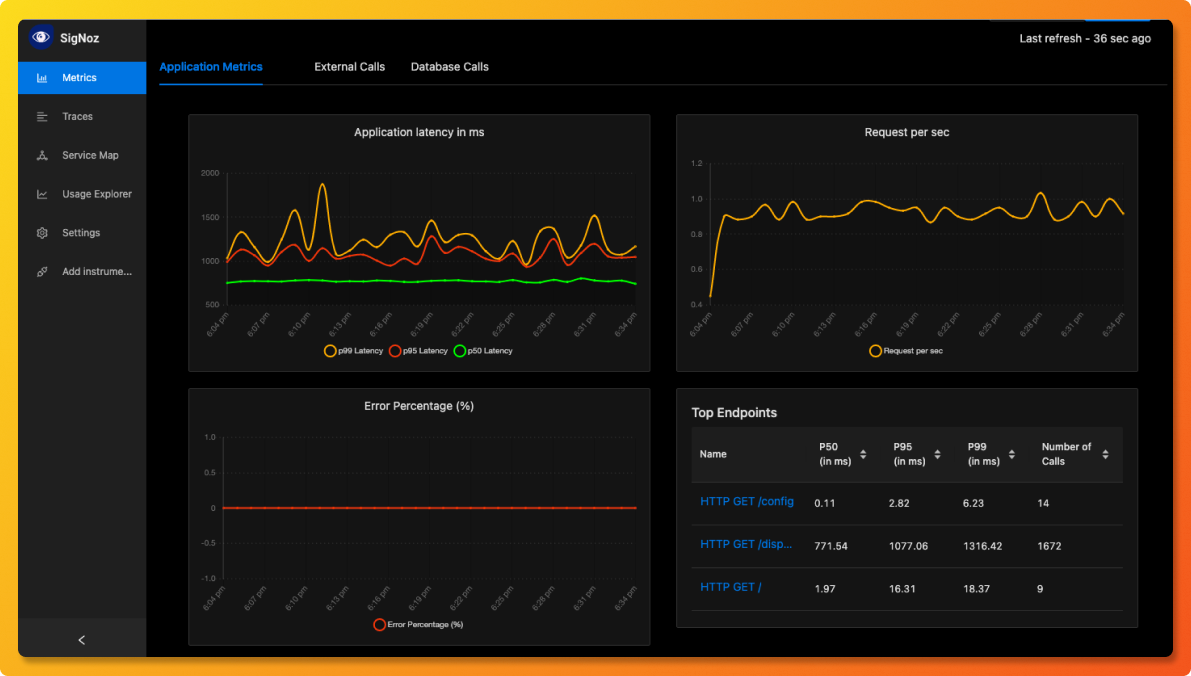
1. SigNoz
SigNoz is a full-stack open-source APM (Application Performance Management) and observability tool. It has the ability to capture metrics, traces, and logs. The ultimate goal is to use collected data to gain insights for ensuring compliance and security of applications and infrastructure. This microservices monitoring tool can easily be hosted within any infrastructure.
SigNoz enables a full-stack observability stack for monitoring microservices applications and helps engineering teams to gain comprehensive observability through:
- Generation of telemetry data (logs, metrics, and traces).
- A storage backend to store the telemetry data, which is quite large.
- A visualization layer for the DevOps teams to consume and take action on.
A unique feature about SigNoz is the fact that it uses OpenTelemetry, which is a vendor-agnostic instrumentation library for generating telemetry data.
2. BuildPiper
BuildPiper, a popular Microservices monitoring tool, renders complete visibility of the deployment status with in-depth reporting on the reasons for failure, enabling a secure, quick, and seamless Microservices deployment. With BuildPiper, DevOps teams can get complete visibility of the deployment status and the pod status after service deployment.
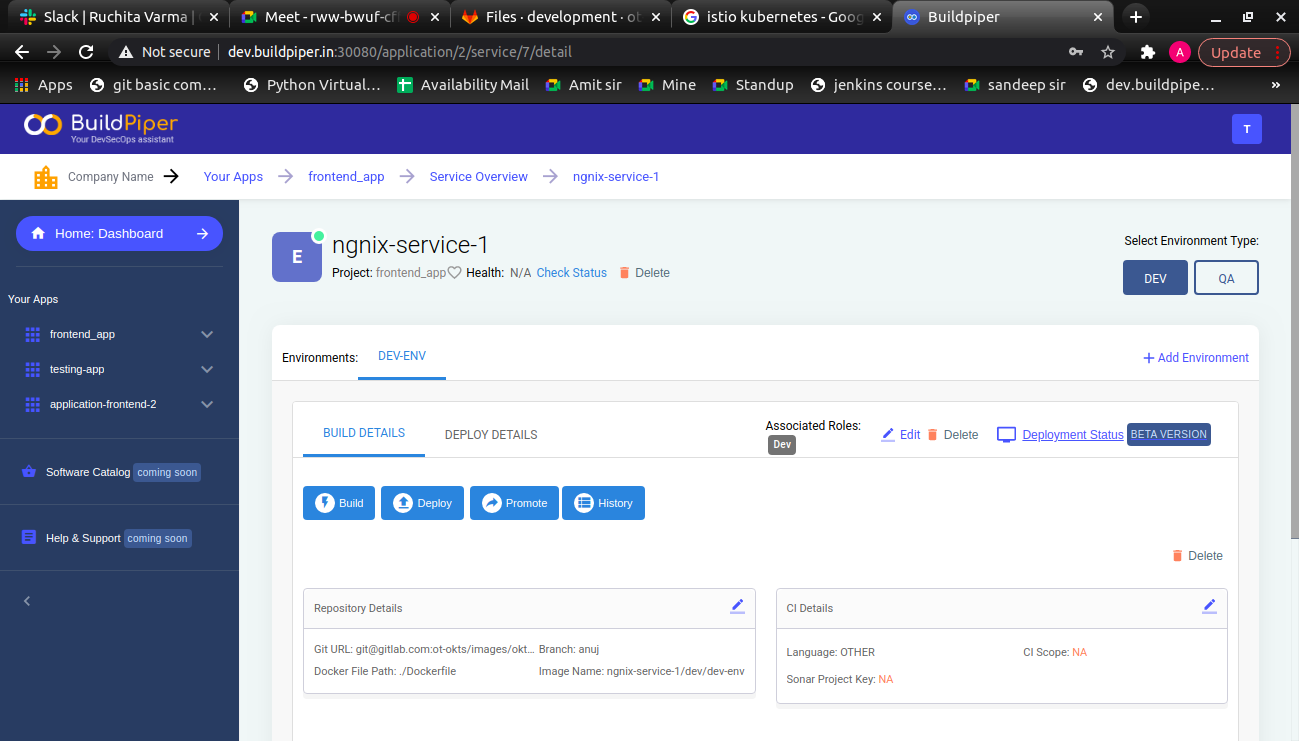
Here’s how to monitor microservices using this product.
BuildPiper empowers DevOps and SRE teams in getting a comprehensive overview of
the deployment status via,
<!--[if !supportLists]-->1. <!--[endif]-->Conditions: It displays the actual condition related to the deployment status.
<!--[if !supportLists]-->2. <!--[endif]-->Container Status: It shows the current status of the containers.
<!--[if !supportLists]-->3. <!--[endif]-->Replication Status: It displays the number of total replicas, ready replicas, available replicas, and non-available replicas.
<!--[if !supportLists]-->4. <!--[endif]-->Autoscaling Status: It helps in knowing whether the auto-scaling feature is enabled or disabled.
<!--[if !supportLists]-->5. <!--[endif]-->Update number of Replicas: The number of replicas can be set manually and the service will be scaled to the updated number of replicas.
<!--[if !supportLists]-->6. <!--[endif]-->YAML Files: Users can view the YAML files of the resources being deployed including the Replica Set Yaml, Pod Yaml, and deployment Yaml.
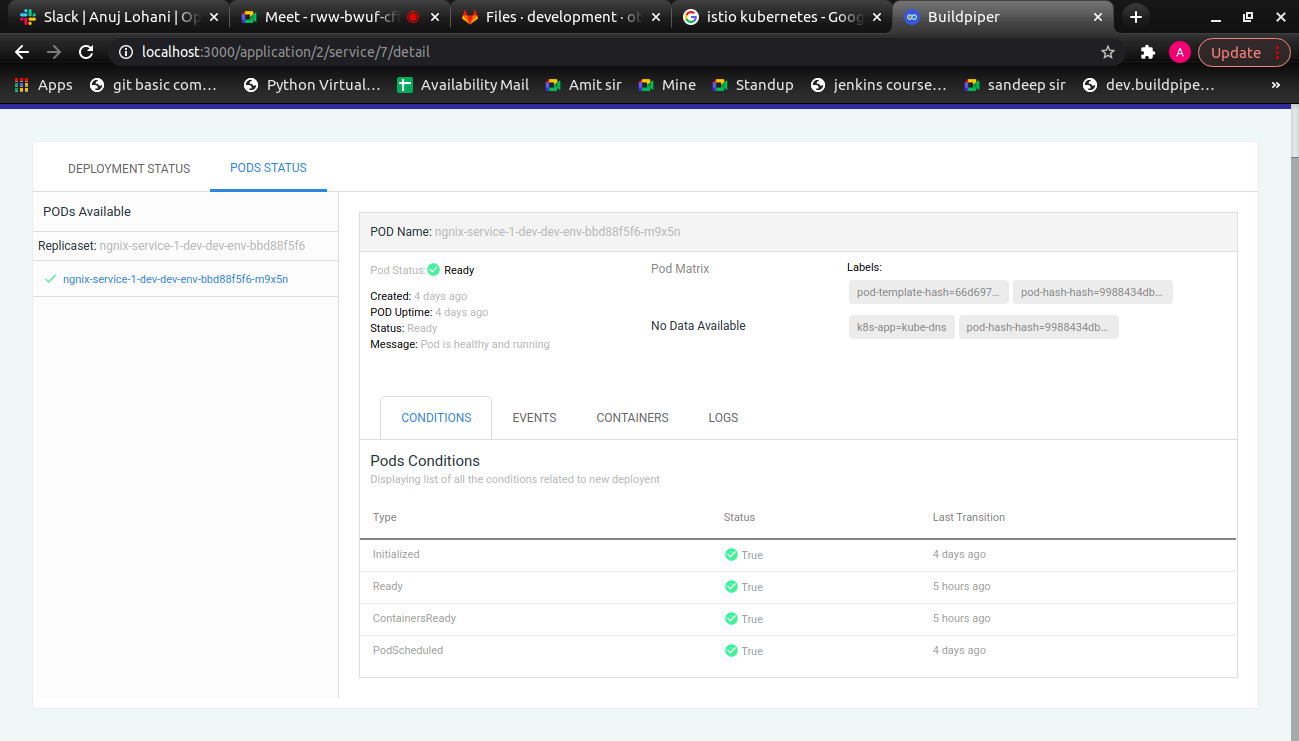
Overview of Pod Status:
BuildPiper renders a comprehensive overview of pod events, conditions related to pods, the number of pods running, and the complete health status of the pods. By providing comprehensive visibility into the app, software teams can get granular details of service deployment. This helps teams in finding issues during service deployment and potential reasons for failure if there are any.
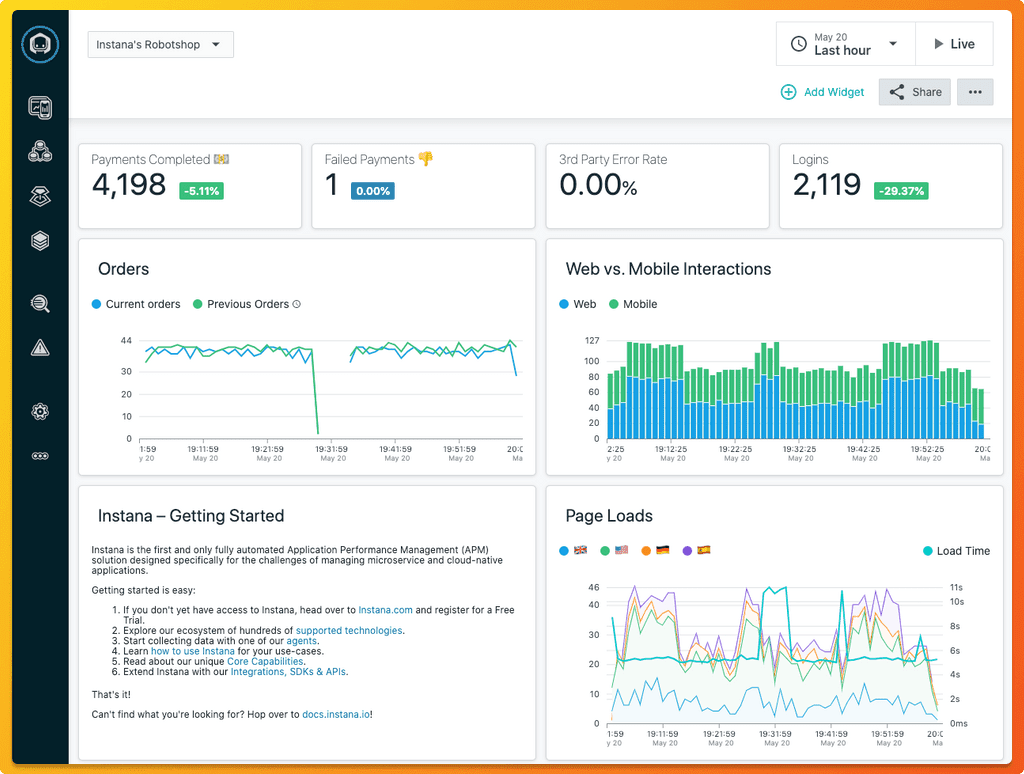
3. Instana
Instana is an automated application monitoring and observability tool. It provides businesses with comprehensive observability to manage and analyze the performance of complex applications and software no matter where they are – public, private, or on-premises. Instana uses an agent for discovering and monitoring the components. It is installed on every host that is to be monitored. Sensors designed to collect data from different technologies are deployed through these agents. Sensors automatically collect configuration, changes, metrics, and events using which DevOps teams can analyze the complete performance of the applications.
4. Dynatrace
Dynatrace is an extensive SaaS enterprise tool that looks after the monitoring needs of large-scale enterprises. It provides an AI engine known as Davis which helps to automate the process of root cause analysis and anomaly detection. Right from infrastructure monitoring to application security, Dyntrace leverages unified AIOps for handling cloud operations, automating DevSecOps, and integrating with all major cloud platforms and technologies.
Teams can easily manage all DevOps operations with this platform that can work seamlessly across Microservices apps and help in monitoring Microservices applications for driving better results.
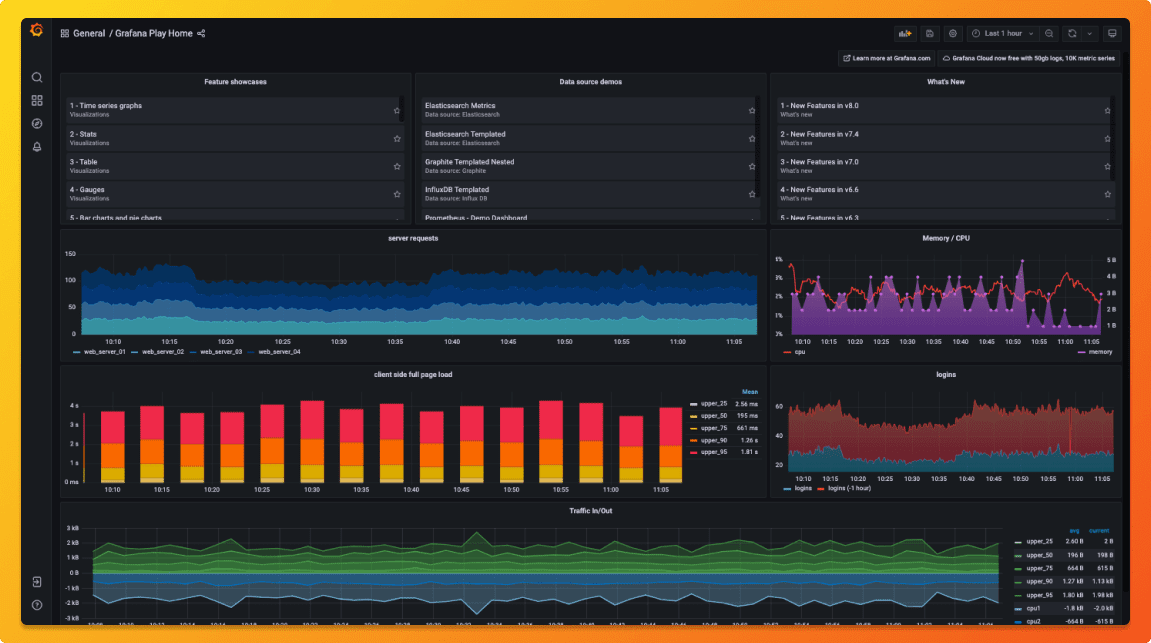
5. Grafana
Grafana is a popular open-source analytics and interactive visualization web layer that provides charts, graphs, and alerts for the web on being supported by compatible data sources. It also supports many different storage backends for time-series data.
It allows DevOps teams to query, visualize, analyze and understand metrics no matter where they are stored. With Grafana, enterprises can create, explore, and share dashboards with teams to view and measure app performance. Grafana provides plugins, dashboards, alerts, and different user-level access for monitoring Microservices applications and for gauging their health status. Here is how to monitor Microservices using Grafana. It renders two versions of services that include,
- Grafana Cloud: Users can send data to Grafana cloud dashboards. Grafana Cloud Logs, Grafana Cloud Metrics, and Grafana Cloud Traces are some of the solutions offered by Google cloud.
- Grafana Enterprise Stack: It provides support for metrics and logs with Grafana installed within the infrastructure.
A Final Note: Observe and Resolve!
Applications in production may fail for various reasons. No matter how safe the application has been built, there can always be a scope for error. If SRE teams fail in gaining clear and comprehensive visibility of the app, they can have a hard time finding and debugging the production issues. Thus, it’s crucial that DevOps and SRE should learn and know how to monitor microservices. Besides this, they need to continuously examine the gathered data to find solutions for problems within the app. Enterprises must invest and try exploring these microservices monitoring tools to get complete observability of their business applications and to keep a check on their health status and performance.
Relevant Blogs:
Recent Comments
No comments
Leave a Comment
We will be happy to hear what you think about this post