Observability Recipes

We discuss the guiding principles for observability, including its components and features, and then discuss recipes to apply it to useful applications.
What Is Observability?
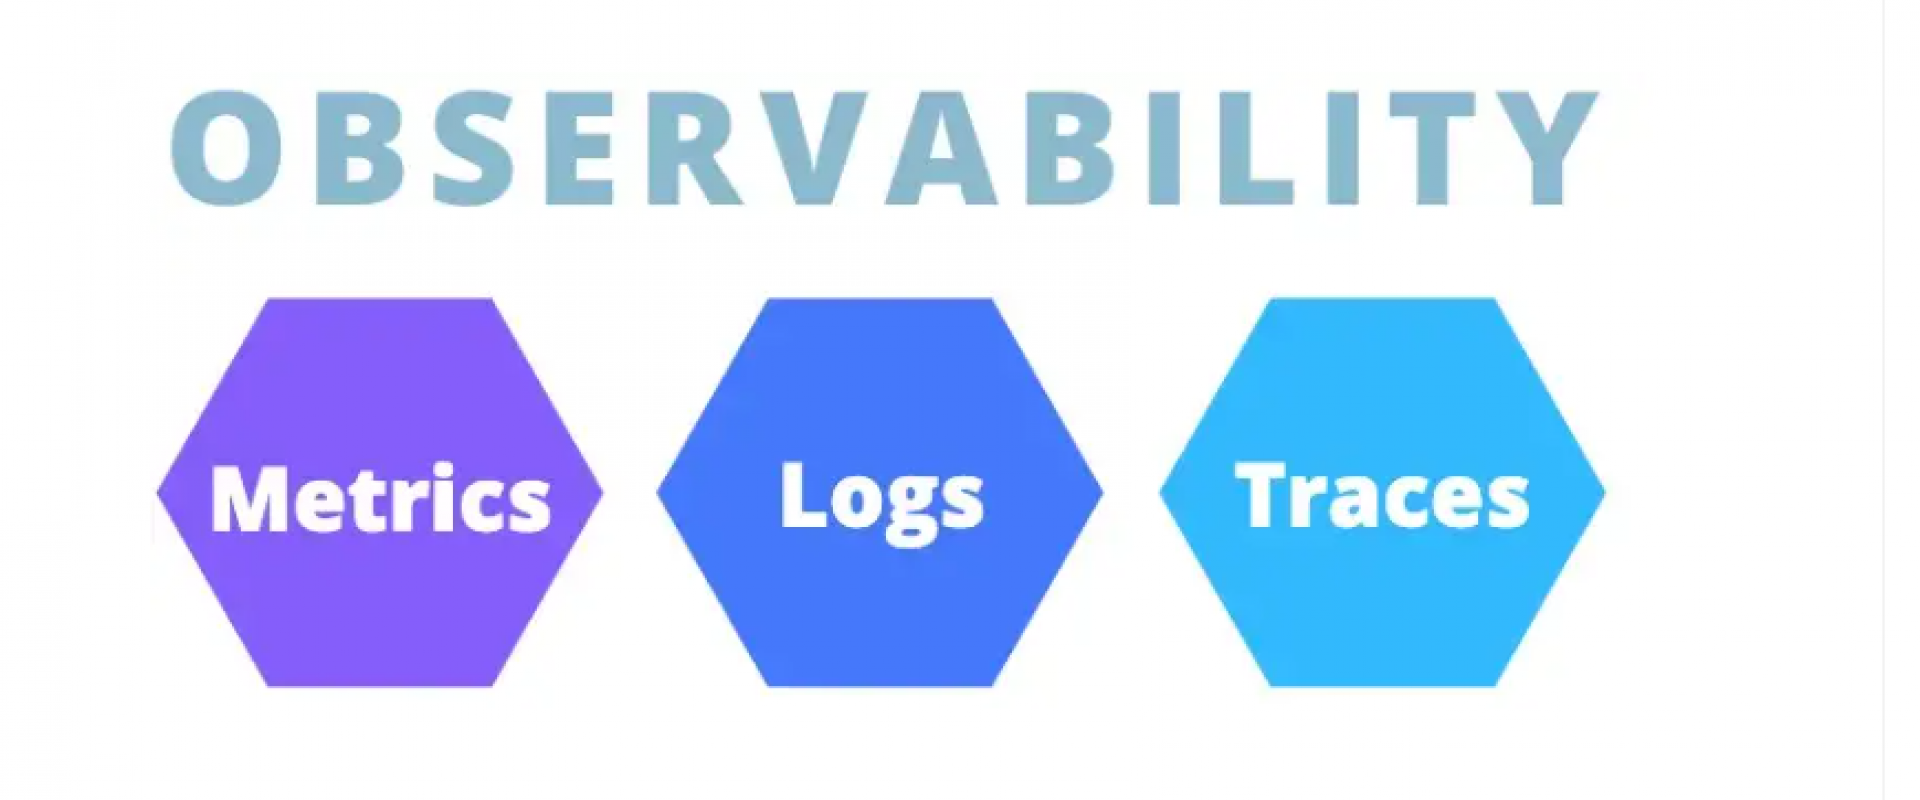
Observability is the ability to derive a valid conclusion of what is happening currently to the system and why it is happening.
Guiding Principles for Observability
1. Context and sequential flow of each end-tend-end request is most important. We need to be able to see what is having an issue, which other parts might/are affected and what are the commonalities of issues when things go wrong.
2. Must be able to cut the data in many ways and correlate the different aspects of a request (e.g. ability to filter for each user, their session, each server node and any of them combined with the other attributes)
3. Use
questions to drive features required for observability instead of relaying on
what we can see.
Observability Components
|
Components |
What is means? |
|
Metrics |
Metrics are
numeric values to help evaluate a service's overall behavior over time.
|
|
Events |
An event is a collection of
data points about what it took to complete a unit of work. they are records
of selected significant points that happened with metadata to provide
context.
|
|
Logs |
Logs are important for
troubleshooting and trying to understand a problem. they provide detail data
and context so one can re-create and diagnose a problem
|
|
Traces |
Traces are important for showing a step-by-step journey of how a request or action as it moves through the system. these give specific insight into the flow and help one to identify errors, find bottlenecks so they can be optimised and rectified. |
|
Visualisation |
Data needs to be connected in a visual and easy to comprehend approach that allows data to be correlated and derive connections from the different data points and events that is happening in the system. This provides context that are otherwise not easily identifiable by looking at individual metrics alone. |
Observability Recipes
Breaking Observability components into recipes, and starting with what questions to answer. We can then list out the data points require to answer them.
Using this approach, we can easily map out what the gaps are for
an existing system, or use it as an implementation pattern for a new system.
An example is as follows:
|
RECIPES |
TYPICAL QUESTIONS TO ASK |
COMPONENTS |
|
||||||
|
METRICS |
EVENTS |
LOGS |
TRACES |
VISUALISATION |
|||||
|
System Health |
|
o Total/Consumed/Avail. CPU/RAM/Storage
o latency o throughput o packet loss |
Service start/stop status |
N/A |
N/A |
Systems health dashboard |
|||
|
Application performance |
|
|
events with metrics as payload or having relevant entries in logs |
N/A |
Core components/service list with top 10 slow transactions |
|
|||
|
User experience |
|
|
|||||||
|
Exception management |
|
|
|
|
detailed object call graph of a request |
Dashboard provides:
|
|||
Besides the above recipes, these a couple that should be considered as well:
1. Release management
o Why did the release of feature "x" failed?
o What went wrong during the release?
o Why did a release take so long to deploy into production?
2. Security monitoring
o Are there are security breaches?
o Are there any abnormal user behavior?
o Are there any new vulnerabilities to my current system?
We ZippyOPS, Provide consulting, implementation, and management services on DevOps, DevSecOps, Cloud, Automated Ops, Microservices, Infrastructure, and Security
Services offered by us: https://www.zippyops.com/services
Our Products: https://www.zippyops.com/products
Our Solutions: https://www.zippyops.com/solutions
For Demo, videos check out YouTube Playlist: https://www.youtube.com/watch?v=4FYvPooN_Tg&list=PLCJ3JpanNyCfXlHahZhYgJH9-rV6ouPro
Relevant Blogs:
Decoding Disaster Recovery Scenarios in AWS
Removing the Bastion Host and Improving the Security in AWS
A Guide to AWS Instance Scheduler
Unexpected AWS Charges You Should Be Monitoring Closely
Recent Comments
No comments
Leave a Comment
We will be happy to hear what you think about this post