Shift-Left Monitoring Approach for Cloud Apps in Containers

It is too costly to have an inefficient code in elastic container-based environments. Shift left monitoring approach with observability solution helps.
Shift-left is an approach to software development and operations that emphasizes testing, monitoring, and automation earlier in the software development lifecycle. The goal of the shift-left approach is to prevent problems before they arise by catching them early and addressing them quickly.
When you identify a scalability issue or a bug early, it is quicker and more cost-effective to resolve it. Moving inefficient code to cloud containers can be costly, as it may activate auto-scaling and increase your monthly bill. Furthermore, you will be in a state of emergency until you can identify, isolate, and fix the issue.
The Problem Statement
I would like to demonstrate to you a case where we managed to avert a potential issue with an application that could have caused a major issue in a production environment.
I was reviewing the performance report of the UAT infrastructure following the recent application change. It was a Spring Boot microservice with MariaDB as the backend, running behind Apache reverse proxy and AWS application load balancer. The new feature was successfully integrated, and all UAT test cases are passed. However, I noticed the performance charts in the MariaDB performance dashboard deviated from pre-deployment patterns.
This is the timeline of the events.
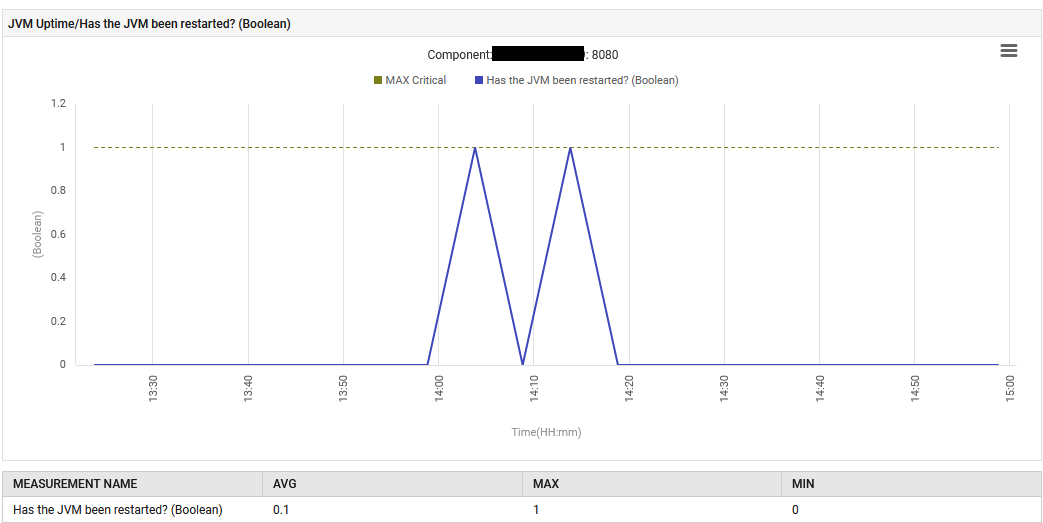
On August 6th at 14:13, The application was restarted with a new Spring Boot jar file containing an embedded Tomcat.
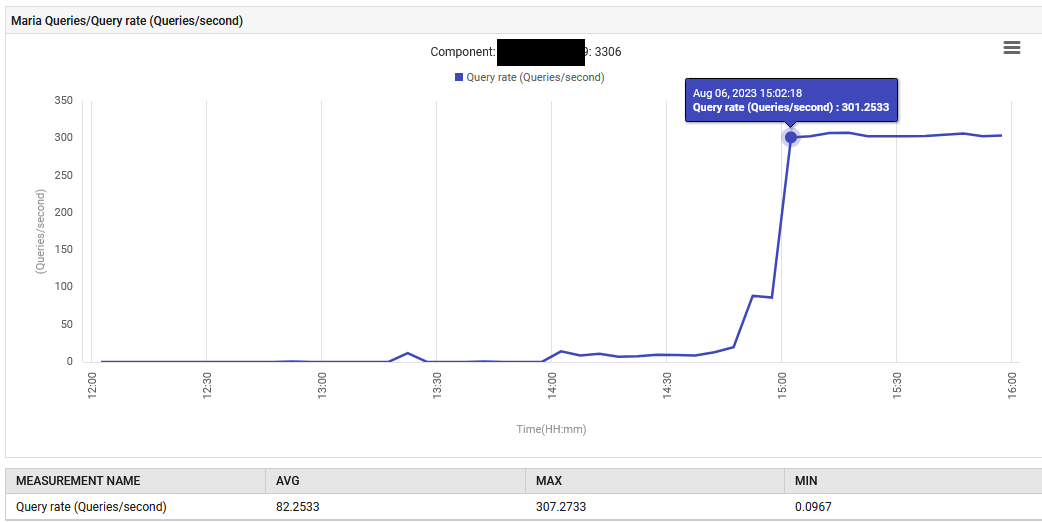
At 14:52, the query processing rate for MariaDB increased from 0.1 to 88 queries per second and then to 301 queries per second.
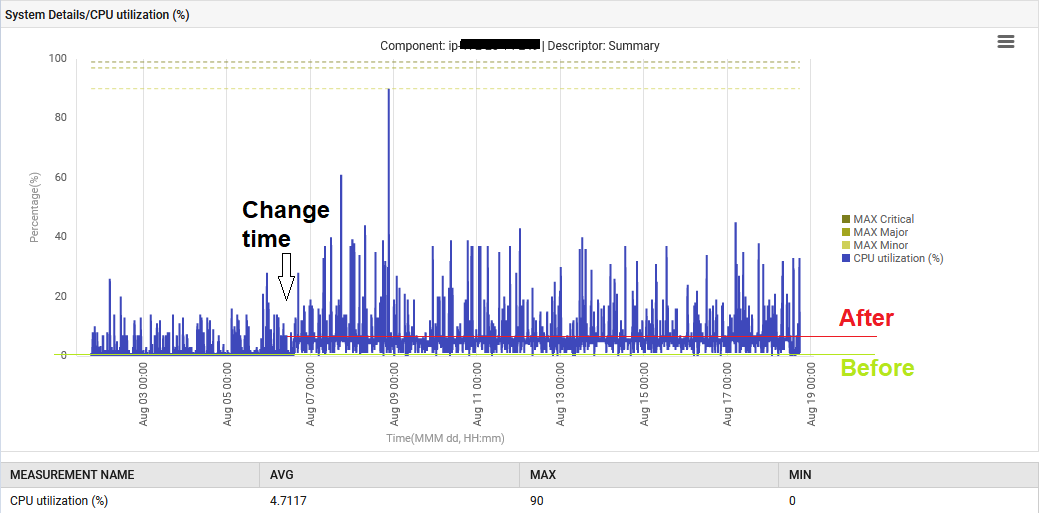
Additionally, the system CPU was elevated from 1% to 6%.
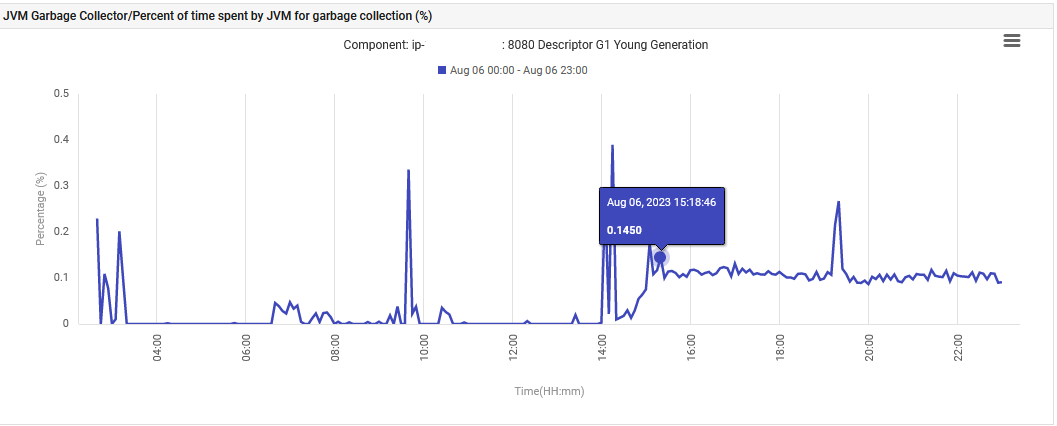
Finally, the JVM time spent on the G1 Young Generation Garbage Collection increased from 0% to 0.1% and remained at that level.
The application, in its UAT phase, is abnormally issuing 300 queries/sec, which is far beyond what it was designed to do. The new feature has caused an increase in database connection, which is why the increase in queries is so drastic. However, the monitoring dashboard showed that the problematic measures were normal before the new version was deployed.
The Resolution
It is a Spring Boot application that uses JPA to query a MariaDB. The application is designed to run on two containers for minimal load but is expected to scale up to ten.

If a single container can generate 300 queries per second, can
it handle 3000 queries per second if all ten containers are operational? Can
the database have enough connections to meet the needs of the other parts of
the application?
We had no other choice but to go back to the developer's table to inspect the changes in Git.
The new change will take a few records from a table and process them. This is what we observed in the service class.
List
No, using the findAll() method
without pagination in Spring's CrudRepository is not efficient. Pagination helps to
reduce the amount of time it takes to retrieve data from the database by
limiting the amount of data fetched. This is what our primary RDBMS education
taught us. Additionally, pagination helps to keep memory usage low to prevent
the application from crashing due to an overload of data, as well as reducing
the Garbage Collection effort of Java Virtual Machine, which was mentioned in
the problem statement above.
This test was conducted using only 2,000 records in one container. If this code were to move to production, where there are around 200,000 records in up to 10 containers, it could have caused the team a lot of stress and worry that day.
The application was rebuilt with the addition of a WHERE clause to the method.
List
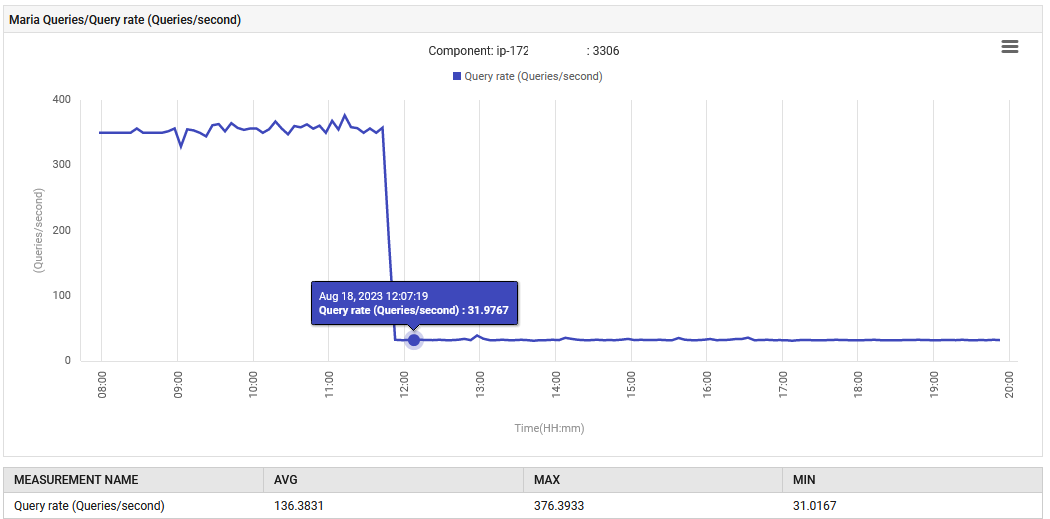
The normal functioning was restored. The number of queries per second was decreased from 300 to 30, and the amount of effort put into garbage collection returned to its original level. Additionally, the system's CPU usage decreased.
Learning and Summary
Anyone who works in Site Reliability Engineering (SRE) will appreciate the significance of this discovery. We were able to act upon it without having to raise a Severity 1 flag. If this flawed package had been deployed in production, it could have triggered the customer's auto-scaling threshold, resulting in new containers being launched even without an additional user load.
There are three main takeaways from this story.
Firstly, it is best practice to turn on an observability solution from the beginning, as it can provide a history of events that can be used to identify potential issues. Without this history, I might not have taken a 0.1% Garbage Collection percentage and 6% CPU consumption seriously, and the code could have been released into production with disastrous consequences. Expanding the scope of the monitoring solution to UAT servers helped the team to identify potential root causes and prevent problems before they occur.
Secondly, performance-related test cases should exist in the testing process, and these should be reviewed by someone with experience in observability. This will ensure the functionality of the code is tested, as well as its performance.
Thirdly, cloud-native performance tracking techniques are good for receiving alerts about high utilization, availability, etc. To achieve observability, you may need to have the right tools and expertise in place. Happy Coding!
We Provide consulting, implementation, and management services on DevOps, DevSecOps, DataOps, Cloud, Automated Ops, Microservices, Infrastructure, and Security
Services offered by us: https://www.zippyops.com/services
Our Products: https://www.zippyops.com/products
Our Solutions: https://www.zippyops.com/solutions
For Demo, videos check out YouTube Playlist: https://www.youtube.com/watch?v=4FYvPooN_Tg&list=PLCJ3JpanNyCfXlHahZhYgJH9-rV6ouPro
If this seems interesting, please email us at [email protected] for a call.
Relevant Blogs:
Recent Comments
No comments
Leave a Comment
We will be happy to hear what you think about this post