The New DevOps Performance Clusters

This post introduces you to the original performance clusters, explains the changes, and describes how you can use the new groups.
In 2022, the Accelerate State of DevOps Report contained a few surprises. One was a change to the traditional performance clusters. The report also introduced a new way to group organizations using an extra dimension.
This post introduces you to the original performance clusters, explains the changes, and describes how you can use the new groups.
Previous Changes
This isn't the first time something has changed. There have been changes over the last eight years as researchers discover new connections or a new direction to explore. In addition, some past changes have had a direct impact on the new clustering technique.
In past DevOps reports, DORA (DevOps Research and Assessment) researchers used four key metrics to divide organizations into sets based on performance:
Throughput
1. Deployment frequency
2. Lead time for changes
Stability
3. Change failure rate
4. Mean time to recovery
In 2018, DORA added a new metric for availability to measure the operational performance of an organization. They later changed this to reliability.
You could measure software delivery performance with the original four metrics (often called the four keys). Then, using all five lets, you measure software delivery and operational performance, often shortened to SDO performance.
Performing well against all five measures drives organizational performance. Your organization is more likely to achieve its goals where teams excel in these metrics. Your operational performance enables the relationship between software delivery performance and organizational outcomes.
Clusters
A cluster is a group of data whose members are more similar to each other than they are to items in another group. This is useful in the State of DevOps report as it allows many organizations to be arranged methodically for comparison.
The research team uses hierarchical clustering to discover the performance groups in the State of DevOps report. This technique doesn't define clusters in advance but lets them emerge from the data.
Researchers test hypotheses using clusters. For example, by grouping organizations based on their deployment frequency, they can see that organizations that deploy more often are more likely to achieve their goals. Then, each time the researchers repeat the analysis on a different sample, they can test the validity of the hypothesis. This scientific approach is how researchers increase their confidence in the practices that drive performance.
Software Delivery Performance Clusters
If you've followed the State of DevOps Report for a while, you'll be familiar with the software delivery performance clusters. Each group represents a different level of performance against throughput and stability metrics. This usually results in four clusters.
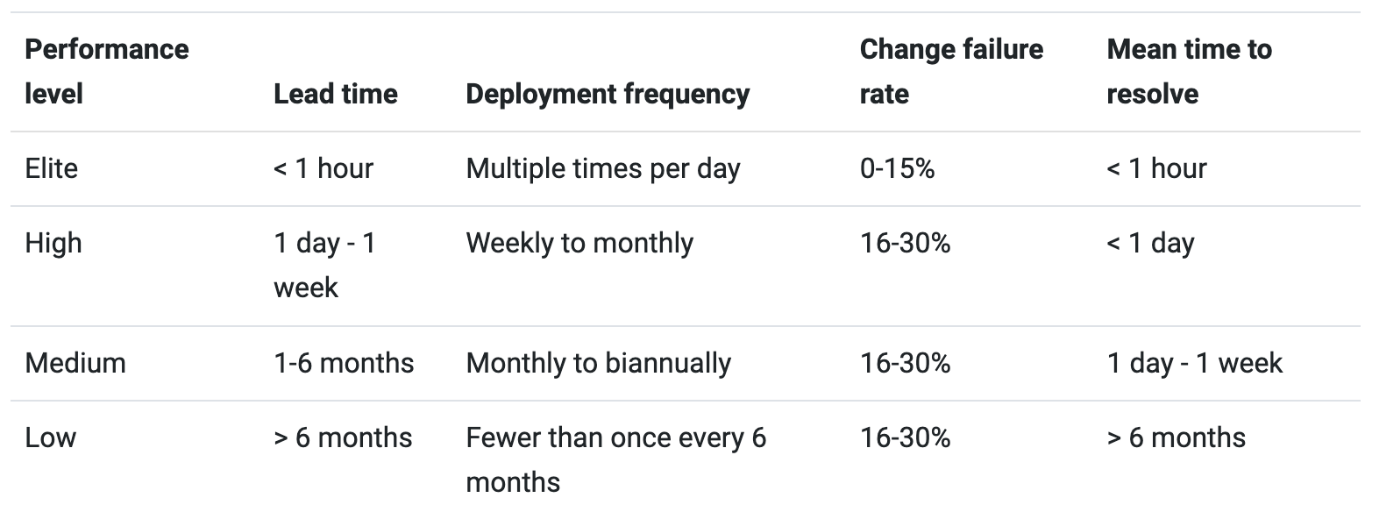
Organizations can compare their software delivery performance to the clusters based on throughput and stability metrics and identify potential improvement areas.
How Software Delivery Clusters Changed in 2022
The most apparent change to the software delivery clusters in 2022 was that there are only three groups rather than four. The removal of the elite performance group is described in more detail later, but let's first consider the changes to the other clusters, as they're just as surprising.
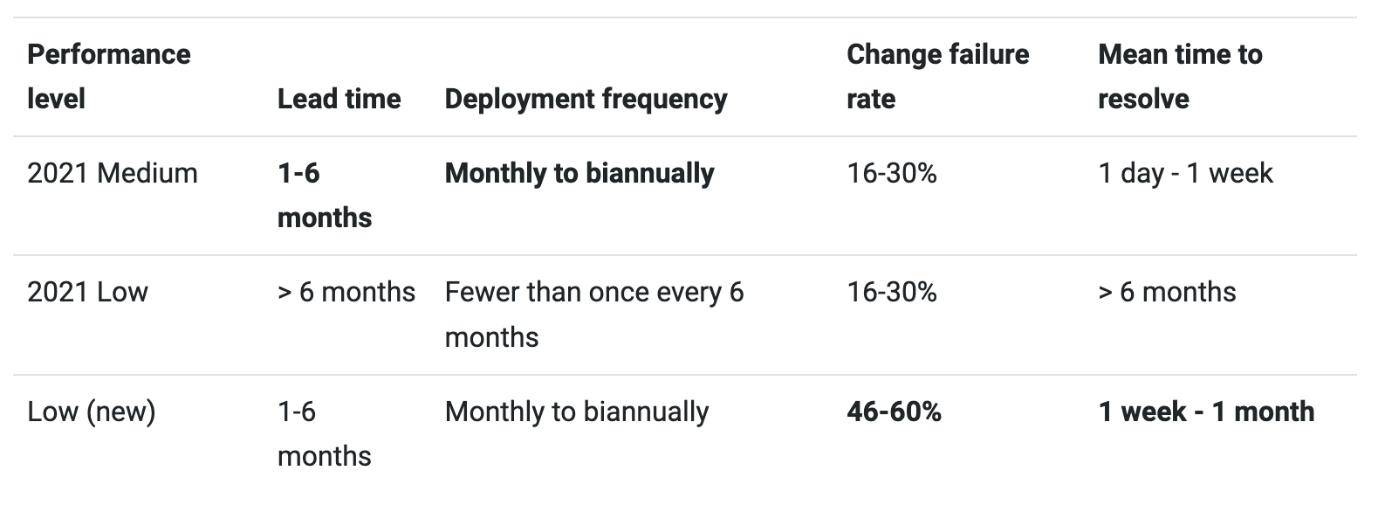
The Low-Performance Group
You'll find the performance of the lowest cluster improved across three metrics, with lead time and deployment frequency matching the medium performance group in 2021. The mean time to resolve has also improved by more than 6x. However, the change failure rate has increased.
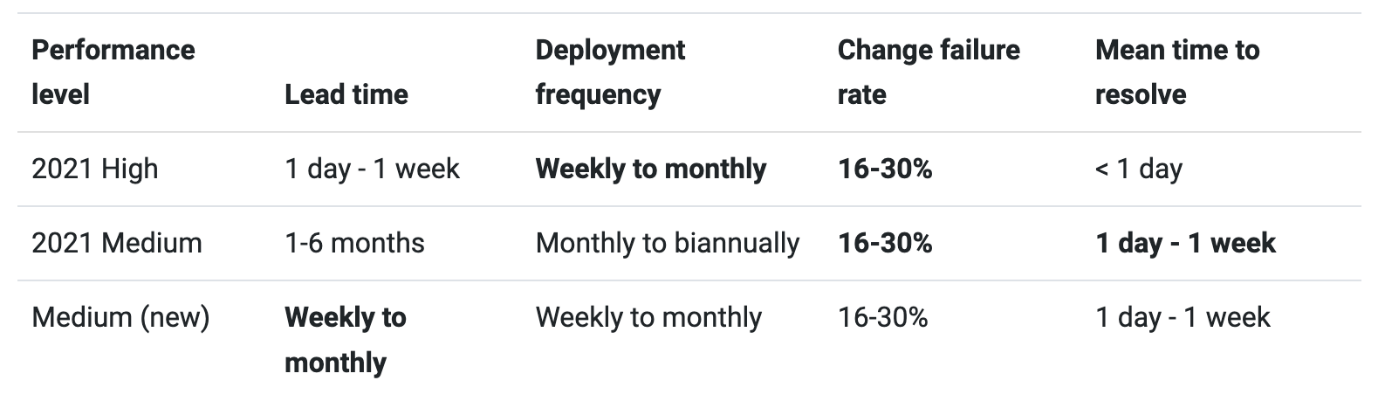
The Medium-Performance Group
The medium-performance group improved against lead time and deployment frequency, matching 2021's high-performance group for these metrics. They also reduced their mean time to resolve and kept the same change failure rates.
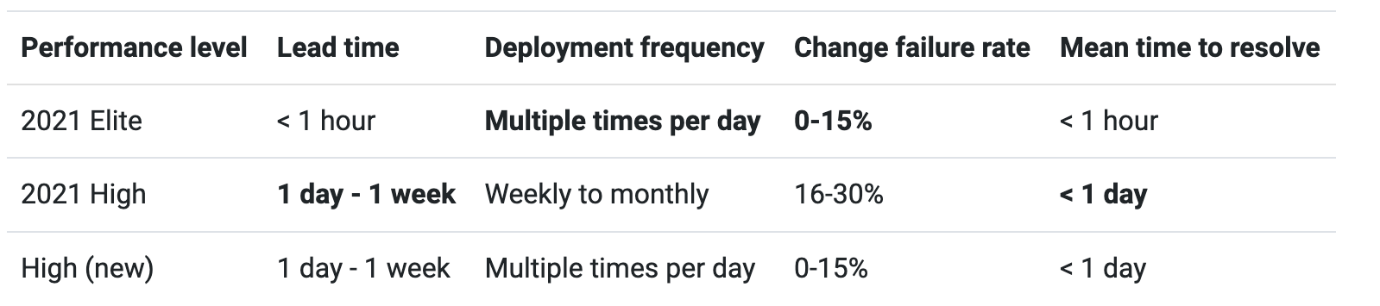
The High-Performance Group
The high-performance group merges the performance of 2021's high and elite clusters.
The Elite Performance Group
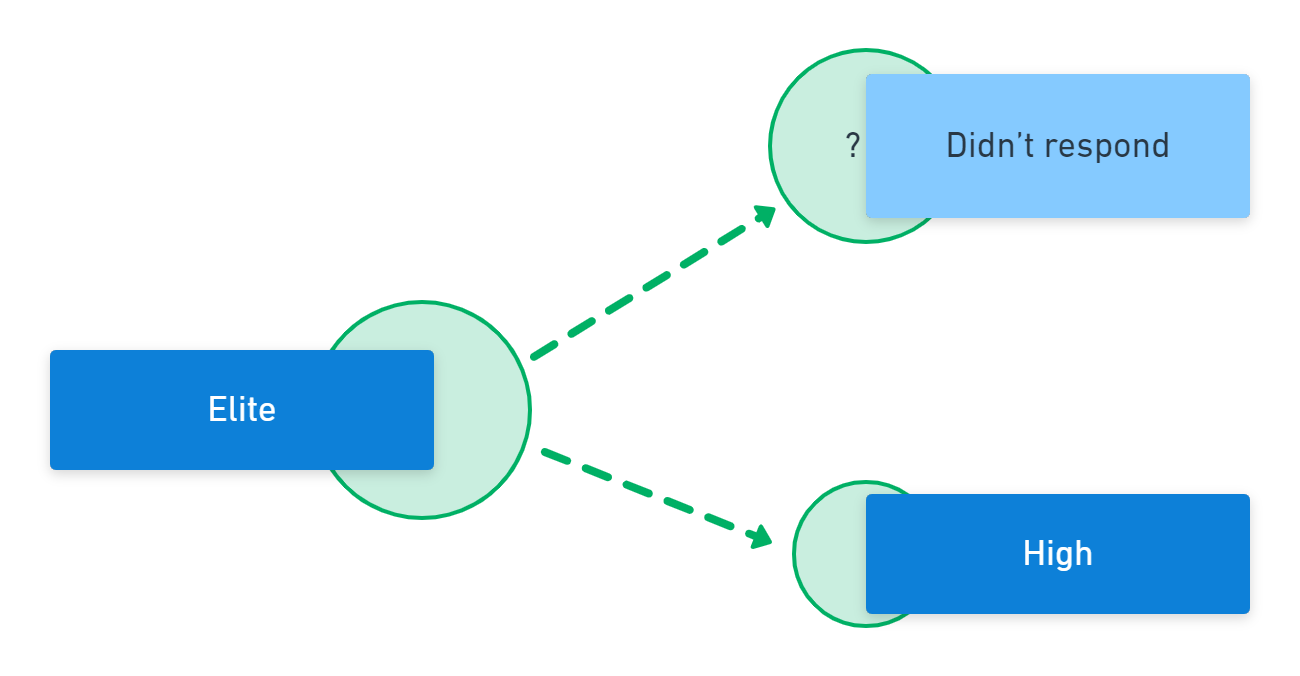
Only three clusters emerged in 2022, so there's no elite-performance group in 2022. There are two explanations for this:
1. The elite respondents in 2022 were absorbed into the improved high-performance cluster.
2. The demographic profile is different in 2022 compared to previous years.
In previous years, many respondents had been in software delivery for over ten years. However, in 2022 the proportion of respondents with more than a decade of experience fell by half. The change seems less surprising as most respondents have less experience than those answering the surveys in prior years.
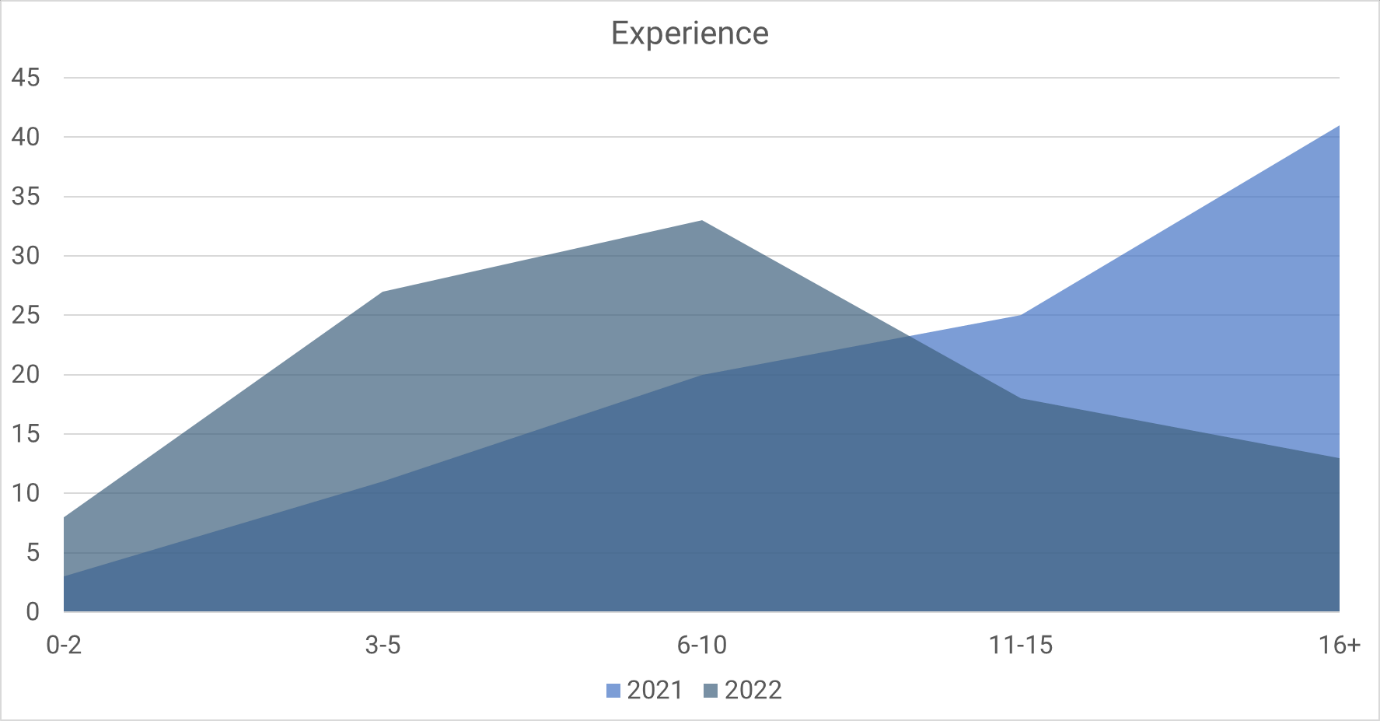
While you can see the clear change in demographics, it's unknown whether this makes the sample more or less representative of the software development industry. When reviewing your team's performance level, you can compare your team's experience with survey respondents to see whether you have access to highly experienced developers who can make a big impact.
The demographic change and subsequent disappearance of the elite cluster suggest that experience drives performance. However, the link between specific capabilities and outcomes remains consistent each year.
Removing the elite performance category doesn't mean these organizations gave up software development. On the contrary, different people respond to the survey each year, and there was an unusual shift in the type of respondents this time. In addition, this year's respondents had less experience overall, so it might not be surprising that they performed less well against the throughput and stability metrics.
Instead of disrupting the annual study of DevOps, the demographic change in respondents has provided a unique opportunity to discover new directions for exploration.
Software Delivery Performance Summary
In the chart below, you will find a comparison of 2021 and 2022. The vertical position of each cluster indicates the level of performance, and the circles show the size of each group.
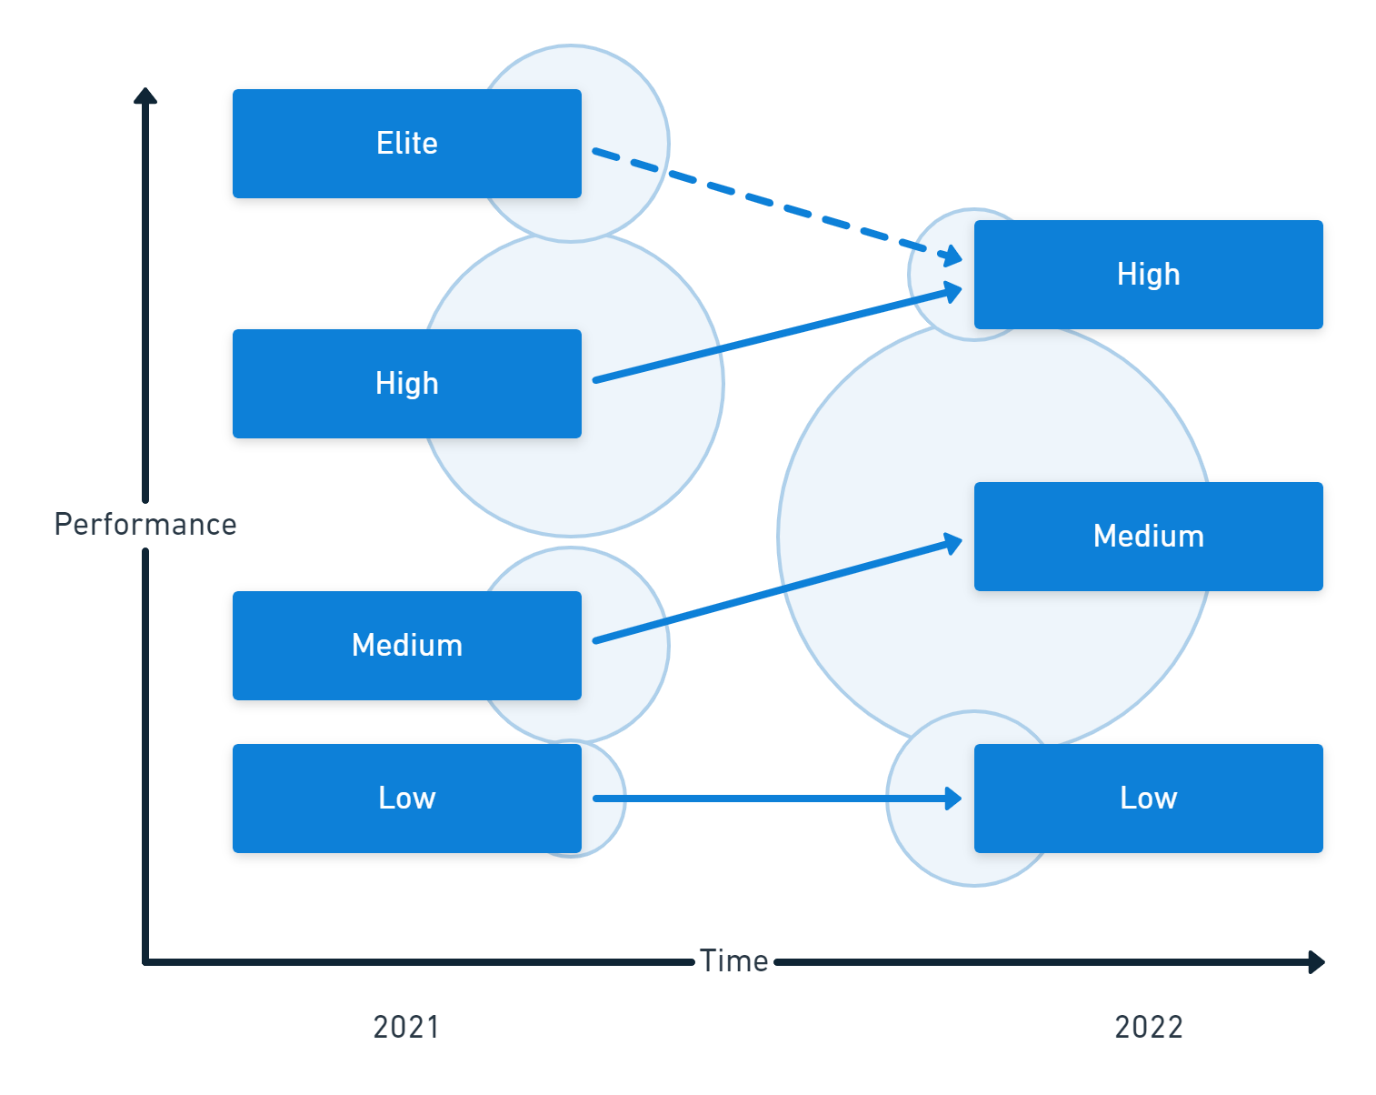
The changes in performance and distribution mean you could consider these as three new performance clusters rather than an evolution of previous ones. Further research is needed to understand these changes, but it's likely to relate to the demographic shift in respondents.
The SDO Performance Clusters
As well as changes to the software delivery groups, DORA added a new breakdown that took operational performance into account. The new clusters for SDO performance use all five metrics for throughput, stability, and operational performance:
Throughput
1. Deployment frequency
2. Lead time for changes
Stability
3. Change failure rate
4. Mean time to recovery
Operational Performance
5. Reliability
The reliability metric captures how often the team achieves its reliability targets.
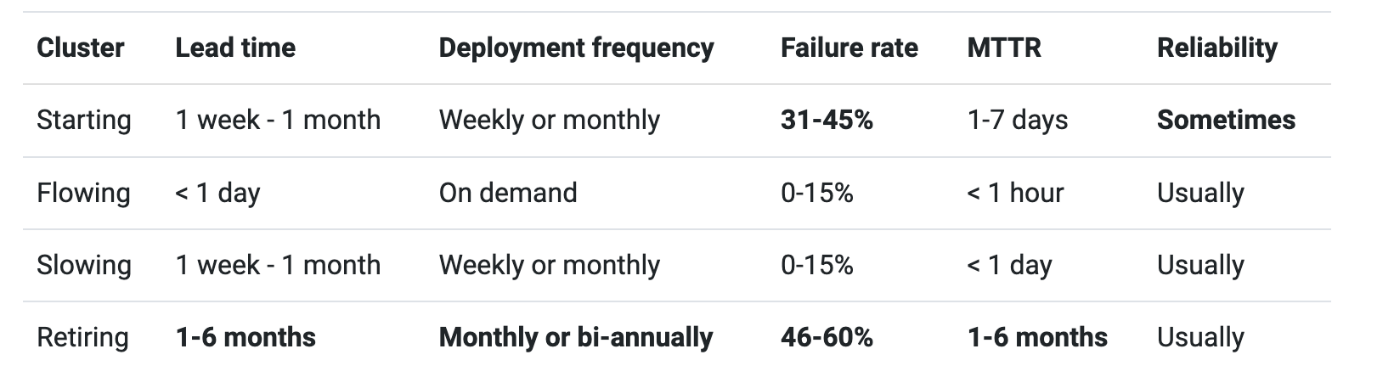
The labels given to groups suggest a scenario where you might expect the associated performance against the metrics. For example, the "starting" cluster exhibits what you might expect from a team in the early stages of product or feature development. This group has modest performance against each dimension. In the early stages, the team may be focused more on innovation than reliability.
Here are the SDO performance clusters, with low performance highlighted:
These groups are more descriptive than the software delivery performance clusters. Rather than striving for high performance across all products and teams, an organization can take a more balanced approach. For example, you can plan for different performance levels from a team working on your core product and one working on a new product.
This approach isn't without its hazards. Many teams remain in the starting group permanently, never resolving the reliability issues that would unlock the positive impact software delivery performance can have on organization-wide achievements. You may have worked on teams that resembled the retiring cluster despite actively developing a software product. The performance characteristics of the retiring cluster would be present in a bureaucratic organization where the operations team acts as gatekeepers, preventing changes from moving through the system to keep things stable.
You can view the cluster names as best-fit explanations for deliberate performance choices. For example, you might choose to give up some reliability to encourage risk-taking and innovation when developing a new idea. If you don't make intentional choices, you risk inventing a narrative to explain poor performance. Future research may test the accuracy of these cluster names.
The most practical application of the new clusters is to use them to focus your efforts on your core software systems. The systems you sell and the line-of-business applications that give you a competitive advantage are the ones to bring into a flowing state first. Never classify these systems as slowing, and only designate a system as retiring when you have an active plan for its withdrawal or replacement.
- Teams in the flowing state more commonly use the capabilities of the DevOps structural equation model, such as:
- Deployment automation
- Loosely coupled architectures
- Continuous Delivery
- Version control
- Flexible work arrangements
Conclusion
The original software delivery performance clusters remain critical in your assessment of performance in your organization. Operational performance unlocks the benefits of high performance, extending their impact to the organizational level. The new SDO performance clusters attempt to demonstrate the importance of reliability to software delivery but may be misleading due to the attempt to assign non-judgmental labels.
The disappearance of the elite performance cluster is likely related to demographic changes. Additionally, this may have led us to discover that a team needs experienced developers to achieve the highest performance levels.
You must consolidate these industry-wide insights with a local measurement strategy to ensure your continuous improvement efforts are led by their actual impact on your organization. The State of DevOps report is a source of inspiration for specific and measurable changes you make to your software delivery process.
We Provide consulting, implementation, and management services on DevOps, DevSecOps, Cloud, Automated Ops, Microservices, Infrastructure, and Security
Services offered by us: https://www.zippyops.com/services
Our Products: https://www.zippyops.com/products
Our Solutions: https://www.zippyops.com/solutions
For Demo, videos check out YouTube Playlist: https://www.youtube.com/watch?v=4FYvPooN_Tg&list=PLCJ3JpanNyCfXlHahZhYgJH9-rV6ouPro
If this seems interesting, please email us at [email protected] for a call.
Recent Comments
No comments
Leave a Comment
We will be happy to hear what you think about this post