To Shift Right, You Need Observability
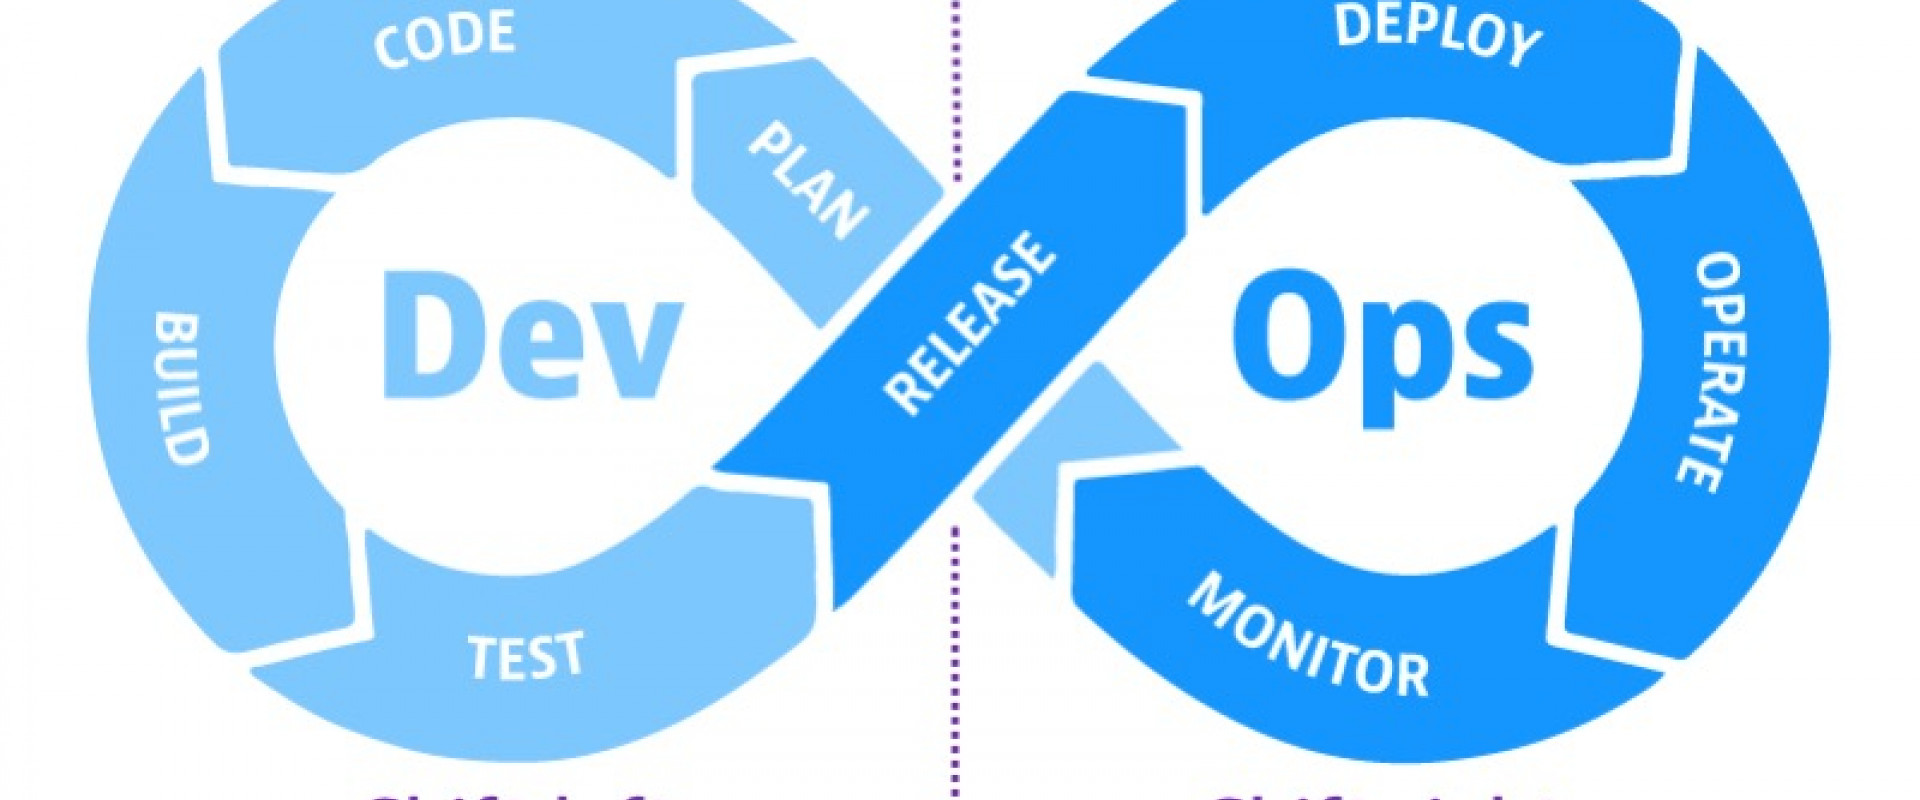
If you're going to purposefully allow bugs to enter production, you need to make sure that your teams have the right tools to fix these bugs quickly.
In a world of shifting left, there is a growing movement: to shift right. I recently attended a panel discussion where the panelists (from tech companies in this space) debated and even insisted – that shifting right will actually allow you to deliver more value to your customers. Then, as they laid out their arguments, one thing became clear: In order to shift right without significant risk, you need extensive observability of your entire application stack.
Shifting Left vs. Shifting Right
First, what does it mean to shift left or right? Well, the shift-left movement came out of something we've known for many years: if you find a problem earlier, it costs less to fix it. The idea is to encourage your developers to do extensive testing, verify functionality in multiple levels of pre-production environments, and catch every issue you possibly can before it goes out to production.
The panel had a simple and obvious argument for shifting right: No matter how much testing you do before you release to production, you're always going to have live bugs. So normalize it. Get people used to quickly finding and resolving bugs in production. This is similar to the idea of Chaos Engineering. Cause problems "on purpose" so that the team can get good at solving them at 3 pm instead of at 3 am.
Now, I won't preach whether your team should shift left or shift right. In reality, as with all things engineering, it depends. There are some things that should be found as early as possible - and others that are hard to find in lower environments, take a large investment in test data, etc. – but there are also some that can be found and fixed very quickly with minimal client disruption in production. This, combined with proper release planning, feature flags, and setting client expectations – means that releasing a bug to production doesn't have to be a crisis.
To be successful at shifting right, though, you need to be able to fix problems fast. And to fix problems fast, you need observability.
To successfully Shift Right, You Need Observability
That is, if you're going to purposefully allow bugs to enter production, you need to make sure that your teams have the right tools to fix these bugs quickly. So again, let me posit: whether you're intentionally trying to shift right or you accidentally deployed a bug, don't you want your team to have all the data they need at their fingertips to first detect that there is indeed a problem and second to pinpoint exactly where the problem is? Observability does exactly that.
How Can We Successfully Troubleshoot Issues in Production?
For many companies, the process of troubleshooting issues in production is very confused today. Operations teams "own" production systems, but they usually don't have the nuanced information to truly solve production issues. In the best case, the problem is something that has happened before or exists in a runbook, and the operations team can solve it themselves. In the worst case, and in the worst-functioning teams, the operations team pages the on-call engineers, who sign onto the call, complain about being woken up "for something so trivial," fix the issue and go back to sleep with a chip on their shoulder about having been woken up in the first place.
One solution is to have the engineers own the on-call rotation - after all, they are the experts of the software that's running in production. I agree with this in principle, but it's not always possible - sometimes, there are too many layers or components of the software, and having so many people on-call isn't feasible. Other times, engineers can't actually see production data, at least not without heavy oversight from other teams (think finance or healthcare industries). Yet other times, with our best intentions, no one is around who is an expert on that particular application - and in a critical system, we can't wait to find that person.
My solution, as you might have guessed: observability! There’s more to it than that, though: give everyone the ability to debug the system through a standard hand-off from Engineering to Operations or whatever team owns the application in production. This hand-off should include everything, from what the component being deployed does, to inputs and outputs, known error handling, dependencies, requirements, etc. From all of these, you can come up with a careful observability plan for your application - and once you have that, you don't need to know the complex business logic of the application in order to troubleshoot many classes of issues.
How an Observability Plan Helps You Troubleshoot More Effectively
Let's look at a typical 3-tier application with a caching layer example:
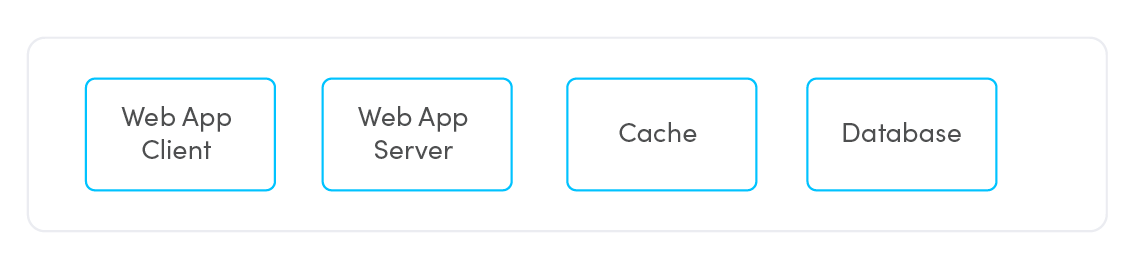
The hand-off information:
- Web App Client talks to Web App Server
- Web App Server talks to Web App Client and the Cache - except if it can't talk to the Cache, it goes to the Database directly.
- The Cache talks to the Web App Server and the Database.
There's more to the story, of course. For example, the actual infrastructure
might look like this:
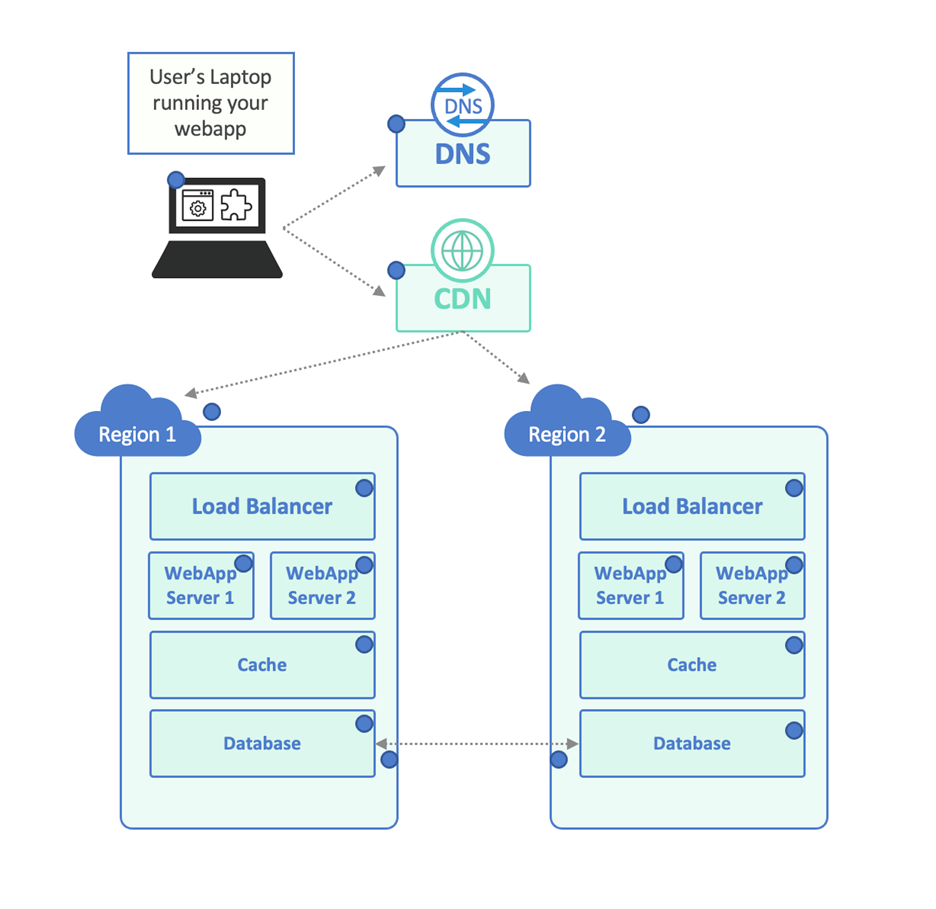
As an aside, it's possible that your Engineering team doesn't know the difference between this functional model and the infrastructure dataflow model - their application may not work at all when deployed to an environment like this - so make sure that infrastructure planning & review are part of the SDLC, to begin with.
Looking at the infrastructure diagram, there’s a lot more needed for a successful hand-off:
- There are client dependencies on the DNS provider, CDN, and Load Balancer.
- Both the CDN and the load balancer need to persist sessions to the right Web App Server.
- Let’s say the caches are local, but the databases need to be consistent, so they are replicated across the cloud regions.
Example: A Working Observability Strategy
This simple example is already getting complex – but let’s come up with an observability strategy for our application. In the example, we added a blue dot to represent every monitoring point:
- We may want to make sure that the client’s environment is working properly – their laptop is able to execute the client application, reach the DNS server, etc. Endpoint Observability or perhaps a Real User Monitoring solution can help with that.
- We want to make sure that third-party services are functioning as required, so perhaps some DNS verification tests and a series of regional CDN tests will ensure that they are being properly balanced between the different cloud regions. These same tests can be used to make sure the cloud regions themselves are working, or we can add dedicated tests for each region to make sure.
- For each of our server-side components, we need to observe inputs and outputs. We can connect to the load balancer and make sure it’s spreading the load between the servers. We can make sure it returns a 200 OK or even a sample query result. Same thing for each individual web server. Same for the cache – we can make sure that it’s up and running, but also that the caching functionality is working properly – perhaps query data twice and look at response headers to make sure that it came from the cache. Same for testing the database directly (the response headers should not say that it came from the cache).
- We can get as complex as we need here – perhaps the application can return metrics when issued a specific API call. We probably want this application to return custom metrics – how long does it get through specific critical regions. We can do it for each request if the request sends a special “magic” header, or we can return summary metrics via an API.
- If the network infrastructure is more complex than this, we might want to add some Layer 3-4 (routing, packet-level) monitoring.
- Finally, since we know that the Databases need to talk to each other in order to synchronize their data, we can set up cross-region tests at both the network layer and the application layer to make sure there’s connectivity and high throughput between them.
Better (Observability) Resolution Leads to Faster (Incident) Resolution
If we look at the picture above, there are a lot of blue dots. That’s the point. You need to have as much data as possible to have full observability of your application! Remove any of them, and now you’re not quite sure where a potential problem resides.
To drive the point home, here’s the same image as above – but shown in lower resolution. You can’t tell what’s going on! That’s what happens when you only monitor the application itself. Maybe you can tell whether it’s up or down, but you don’t have any visibility into the details.
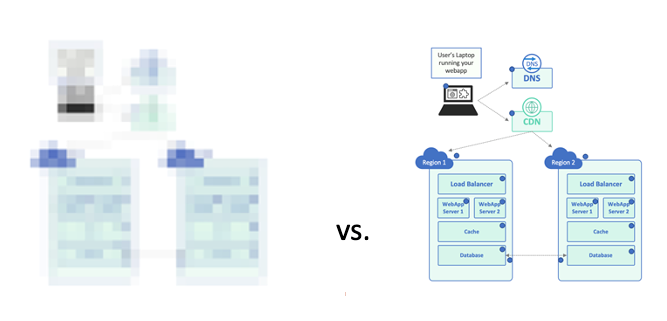
We can keep adding more dots for even better resolution, but let’s look at what we’ve achieved even with this relatively simple strategy:
- By running these tests during “normal” times, we’ve identified baselines. Now we know how long each component should take, what its error rate is, etc., we can create SLOs for those baselines so that if the performance degrades, we’re notified and know exactly what went wrong.
- If a problem happens, we have full 360-degree visibility from the vantage point of the client and of the individual infrastructure components. We can pinpoint an issue immediately to a particular component.
Suddenly, with a proper hand-off like this, there are fewer, shorter incident calls – and if one does need to be escalated to Engineering, the problem has already been narrowed down, so it's a lot quicker to fix. If you're going to shift right, this is the way to do it. If you're not going to, you're still going to have production issues - so still make sure you have a proper engineering hand-off. Everyone involved will be happier because of it.
We Provide consulting, implementation, and management services on DevOps, DevSecOps, Cloud, Automated Ops, Microservices, Infrastructure, and Security
Services offered by us: https://www.zippyops.com/services
Our Products: https://www.zippyops.com/products
Our Solutions: https://www.zippyops.com/solutions
For Demo, videos check out YouTube Playlist: https://www.youtube.com/watch?v=4FYvPooN_Tg&list=PLCJ3JpanNyCfXlHahZhYgJH9-rV6ouPro
If this seems interesting, please email us at [email protected] for a call.
Relevant blogs:
Recent Comments
No comments
Leave a Comment
We will be happy to hear what you think about this post