What Is Kubernetes Dashboard and Its Alternatives
Open-source Kubernetes Dashboard is helpful for UI-based deployment and management of resources but its pitfalls make users adopt alternatives.
Kubernetes provides a command line (CLI) component called “kubectl” for carrying core operations. But there are two significant hurdles to using CLI enterprise-wide
- The high learning curve for developers to adopt Kubernetes for deployment.
- Time-consuming and frustrating work for SREs and Ops team to monitor and troubleshoot multiple clusters at scale
Dashboard by Kubernetes ( also known as Kubernetes Dashboard) is a web-based user interface to deploy applications into the Kubernetes cluster, monitor the health of all the resources and troubleshoot them in case of any issues. The application is helpful for DevOps, Ops, and SRE teams to manage Kubernetes resources such as Deployments, Statefulsets, Jobs, etc. One can quickly deploy an application using manifest files and update the help from the UI itself.
Features of Kubernetes Dashboard
Kubernetes Dashboard is compelling for the DevOps team because of two primary features:
- Cluster-wide visibility and troubleshooting
- UI-based deployments
Cluster-wide Visibility and Troubleshooting
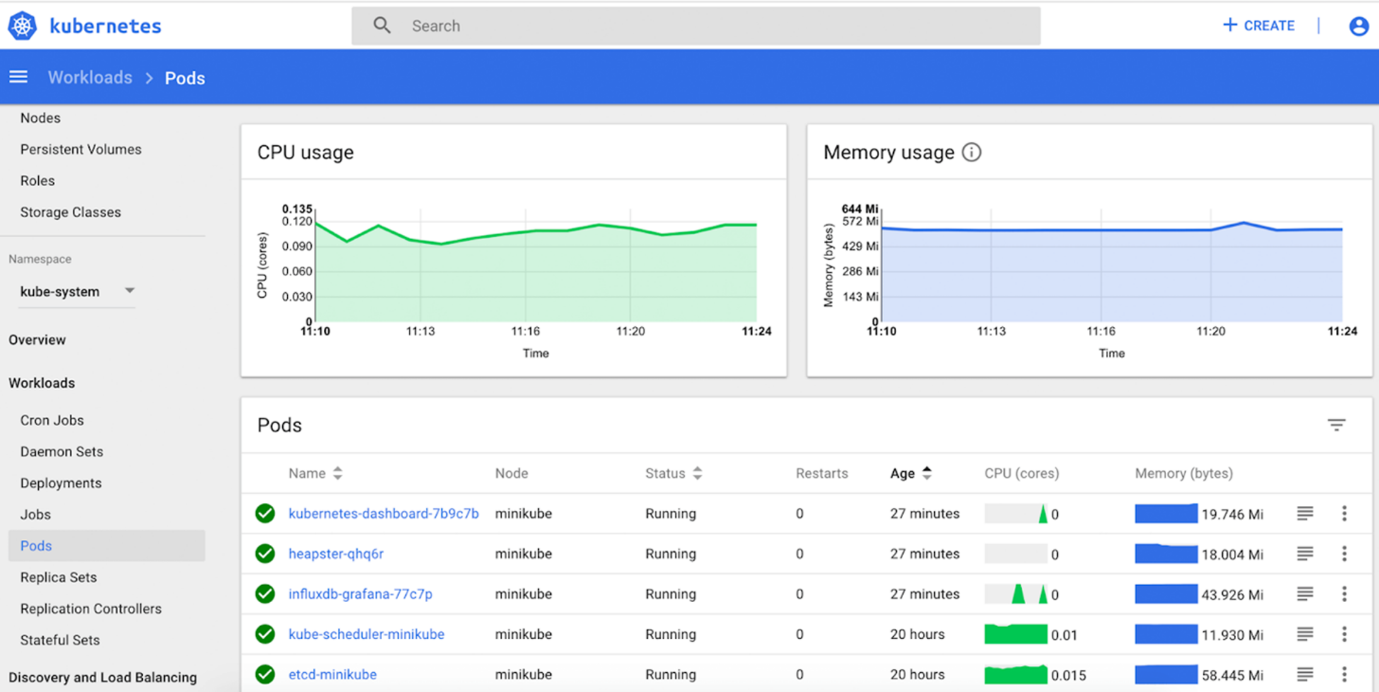
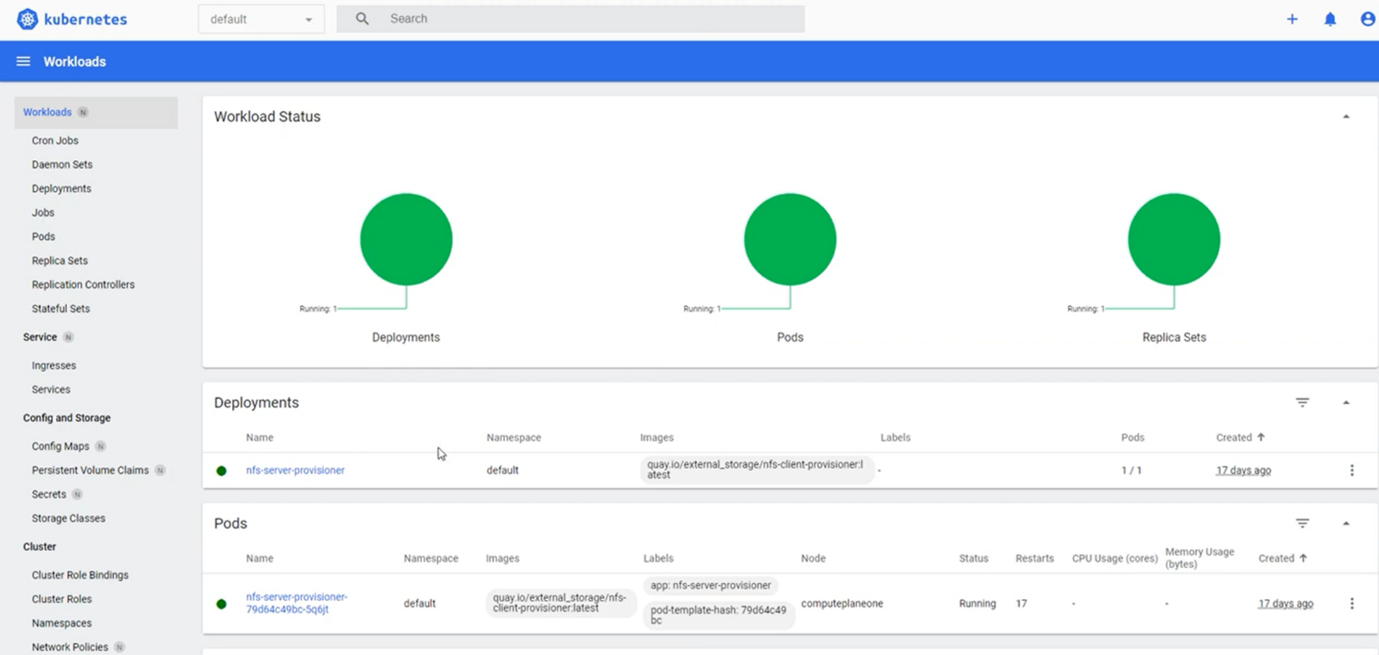
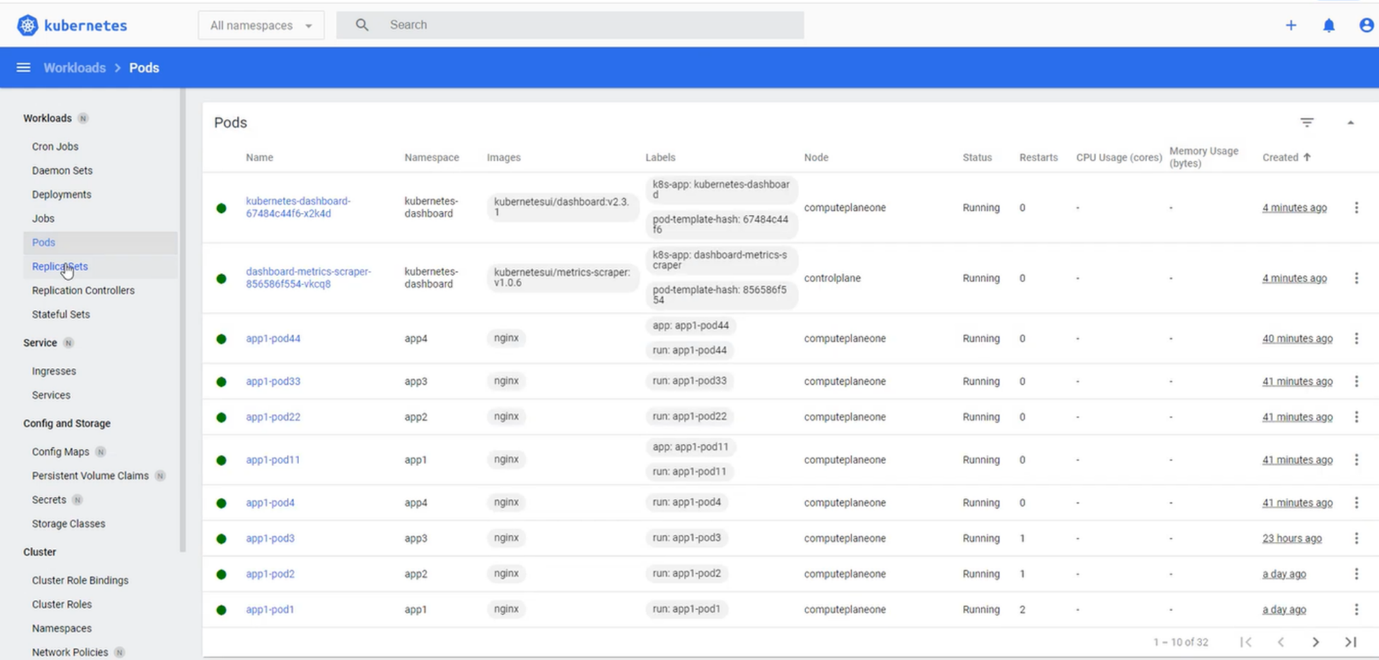
The Kubernetes Dashboard will provide a view of various running workloads and their total count. DevOps engineers will get the visibility of workloads, services, configurations and storage, and cluster view.
Workload View
Under the workload view, users will get the details of workloads resources such as Deployments, Pods, ReplicaSets, DaemonSets, Job, and StatefulSet running in all the namespaces of a cluster. One can also perform a granular search based on a particular namespace in a cluster.
Pods View
One of the most important aspects of workloads can be the number of pods running in a specific node and its respective namespace.
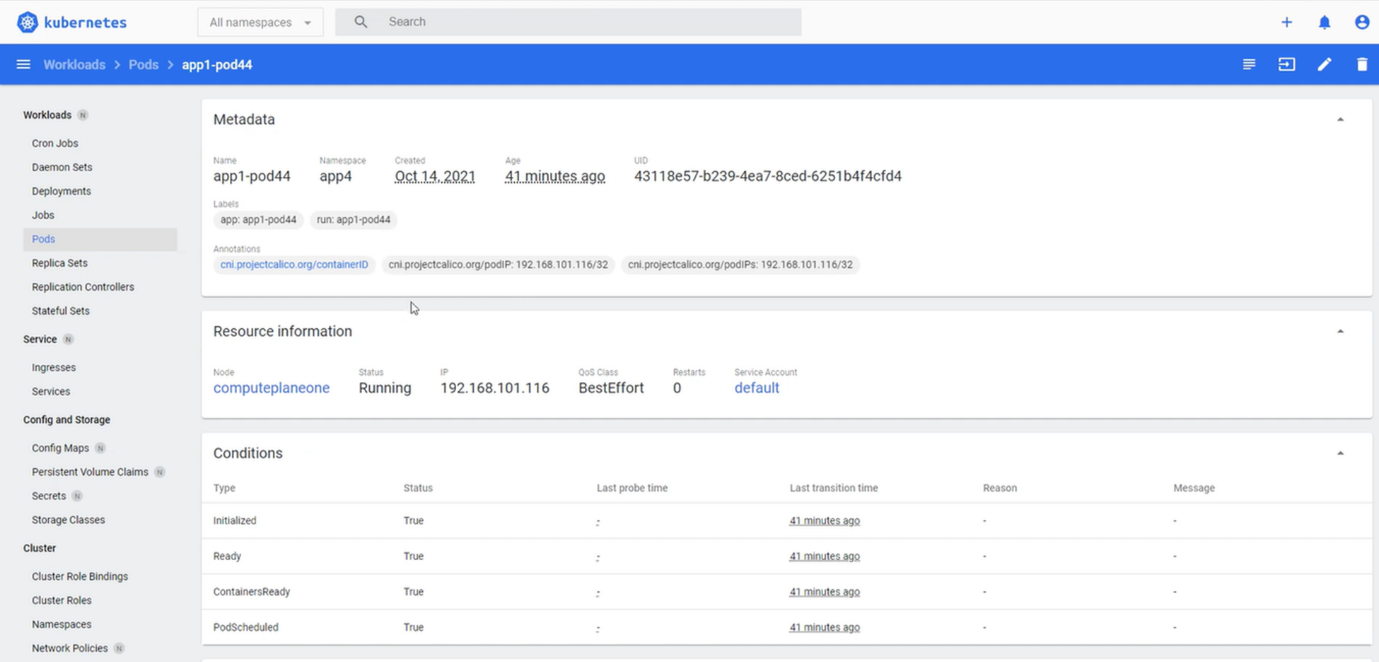
Users will get drilled-down information about a pod, such as:
- Metadata about labels and annotations
- Resource consumption - CPU and memory utilization
- Date of creation and number of restarts
- Events logs and persistent volume claim
Similarly, Kubernetes Dashboard provides an aggregated view of namespaces and a detailed view of services & ingress objects, configmaps, network policies, secrets, and persistent volume claims in a namespace.
Service and Ingress View
Kubernetes Dashboard provides visibility about running Services and Ingress objects, including the namespace each Service or ingress belongs to, their labels, and Cluster IP. Users can get far more drilled-down information about each Service, such as labels, pods, endpoints, etc.
Configuration and Storage View
Similar to any other object views, the Kubernetes Dashboard allows the details of Persistent Volume Claims (PCVs) in a cluster along with their status, storage volume, storage class, annotations, labels, namespaces, etc. The Dashboard also shows the configurations of the applications deployed into the cluster, which can be edited from the UI directly.
UI-Based Deployment
The Kubernetes Dashboard allows you to deploy any (workload) resources from the UI. You can create manifest files in the browser, or you can upload your manifest files from a source such as Git. And the Kubernetes Dashboard will directly communicate with the Kubernetes controller to get an object of a resource created for you. In the below example, we have created a manifest file to create a pod with NGINX 1.19.0 image to create a pod.
Kubernetes Dashboard Architecture
Kubernetes Dashboard is an external service developed on top of Kubernetes architecture. Under the hood, the Dashboard uses APIs to read all cluster-wide information for visibility into a single pane. It also uses the APIs to deploy resources and applications into a cluster. Both CLI and Kubernetes Dashboards depend on the kube-API-server to process the requests. To get started with the CLI, the Ops team must deploy the Kubernetes Dashboard in the same cluster (similar to Kubectl deployment).
- Lack of multicluster view: Kubernetes Dashboard provides the view pertinent to namespaces in a single cluster. It does not offer a view of multiple clusters.
-
Minimal RBAC: Kubernetes
does not provide granular access control for various users. One has to be
dependent on the token or
kubeconfigfiles. - Lack of Single Sign On(SSO): Kubernetes Dashboard does not provide SSO login services. SSO is essential for mid and large enterprises to secure resources and applications in Kubernetes.
- No Node management: Kubernetes Dashboard DevOps team to view the node information such as status, labels, limits, memory/CPU requests, machine ID, addresses, allocated resources, pods, etc. But does not allow any provision to edit nodes. This is essential because if a node is unhealthy, it will not run any pods and will not participate in cluster activity.
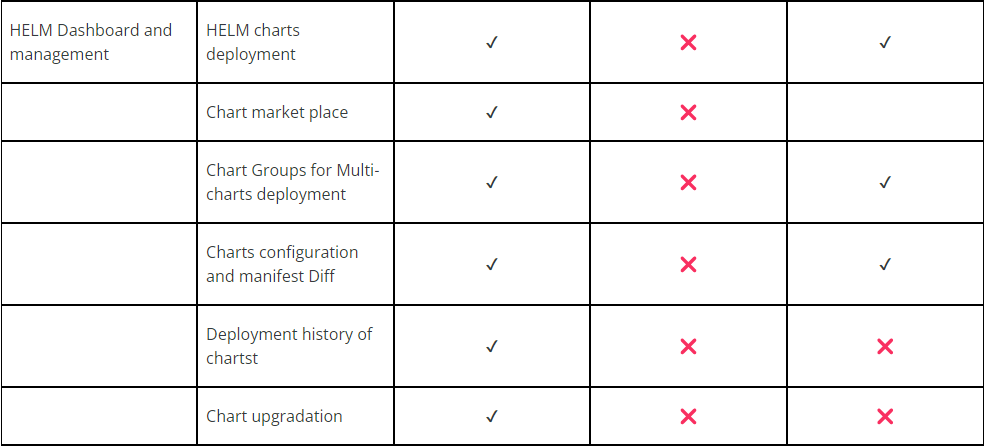
- Zero visibility and manageability of HELM charts: Many organizations use them to deploy their Kubernetes applications at scale. Unfortunately, Kubernetes Dashboard does not provide the capability to HELM Dashboards.
- Lack of application view: Kubernetes Dashboard provides the resource or object view but needs more information about applications, making it cumbersome for developers to modify any deployments. Without application view, Kubernetes Dashboard has restricted its usage to only the Ops team.
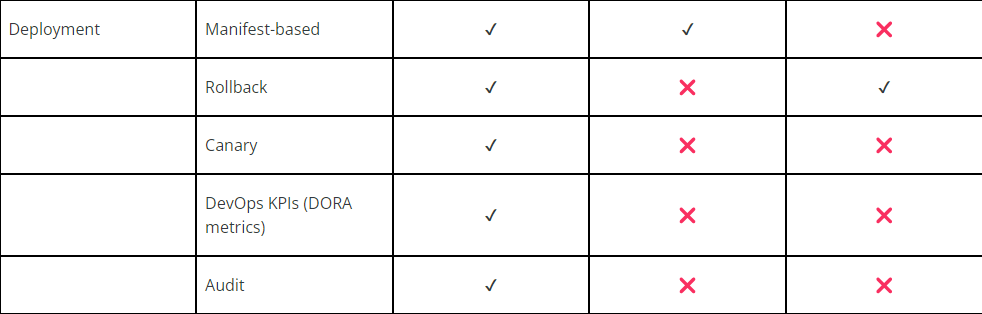
- Audit: Kubernetes Dashboard does not offer audit reports of deployments, such as who, when, and how an application is being deployed.
Note, although Kubernetes Dashboard is also developed to make the deployment easy from UI, today, there is no mechanism to apply advanced deployment strategies such as canary from the UI.
Open Source Alternatives to Kubernetes Dashboards
There are four open-source alternatives to Kubernetes Dashboard, either built independently or on the top of the Dashboard project, to increase the capability of deployments, monitoring, and troubleshooting from UI.
1. Devtron Kubernetes Dashboard:
Devtron provides an open-source Kubernetes-native DevOps platform that automates the entire software delivery process from CI, CD, GitOps, security and governance, progressive deployment, observability, monitoring, and troubleshooting. Devtron Kubernetes dashboard provides powerful features in a single pane to make DevOps, SREs, and developers' life simpler
2. OpenLens:
An open-source software with an MIT license is used for multicluster management and monitoring workloads. It also provides basic HELM resource management and resource grouping, but it may require a learning curve. Secondly, it has a few blind spots as it does not provide HELM chart groups for multicluster deployments, Chart config differences, etc.
3. Octant:
Open source dashboard started by VMware but is archived now- no community support, and you are on your own. Initially, the project was targeted for developers to use the UI to ship code faster into clusters. Octane has limited functionalities wrt cluster visualization and management.
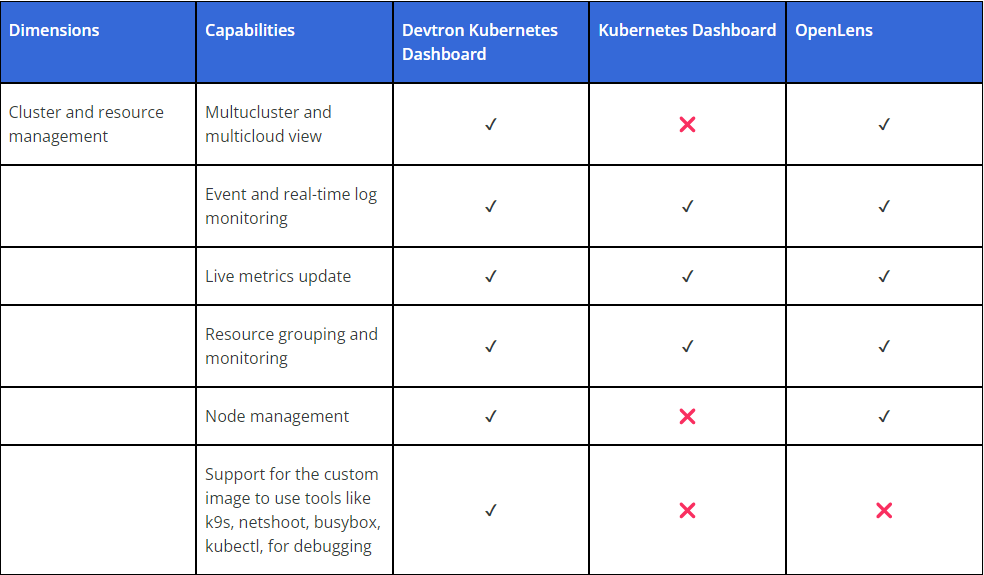
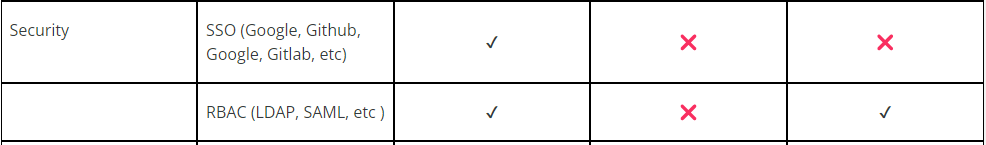
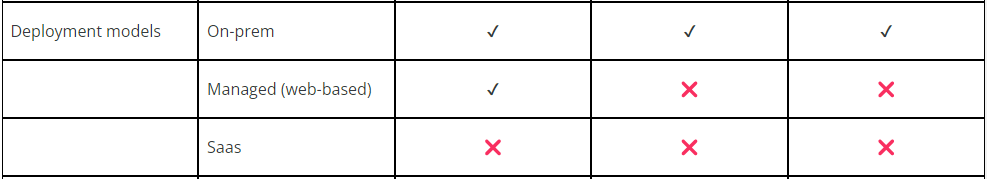
Tabular Comparison
Vanilla Kubernetes Dashboard vs Devtron Kubernetes dashboard vs OpenLens.
Cluster and Resource Management

We Provide consulting, implementation, and management services on DevOps, DevSecOps, Cloud, Automated Ops, Microservices, Infrastructure, and Security
Services offered by us: https://www.zippyops.com/services
Our Products: https://www.zippyops.com/products
Our Solutions: https://www.zippyops.com/solutions
For Demo, videos check out YouTube Playlist: https://www.youtube.com/watch?v=4FYvPooN_Tg&list=PLCJ3JpanNyCfXlHahZhYgJH9-rV6ouPro
If this seems interesting, please email us at [email protected] for a call.
Recent Comments
No comments
Leave a Comment
We will be happy to hear what you think about this post