Microservice Design Patterns

Looking at monitoring the lifecycle of a request example. This post covers specific design patterns to help us build reliable, secure, and traceable microservices.
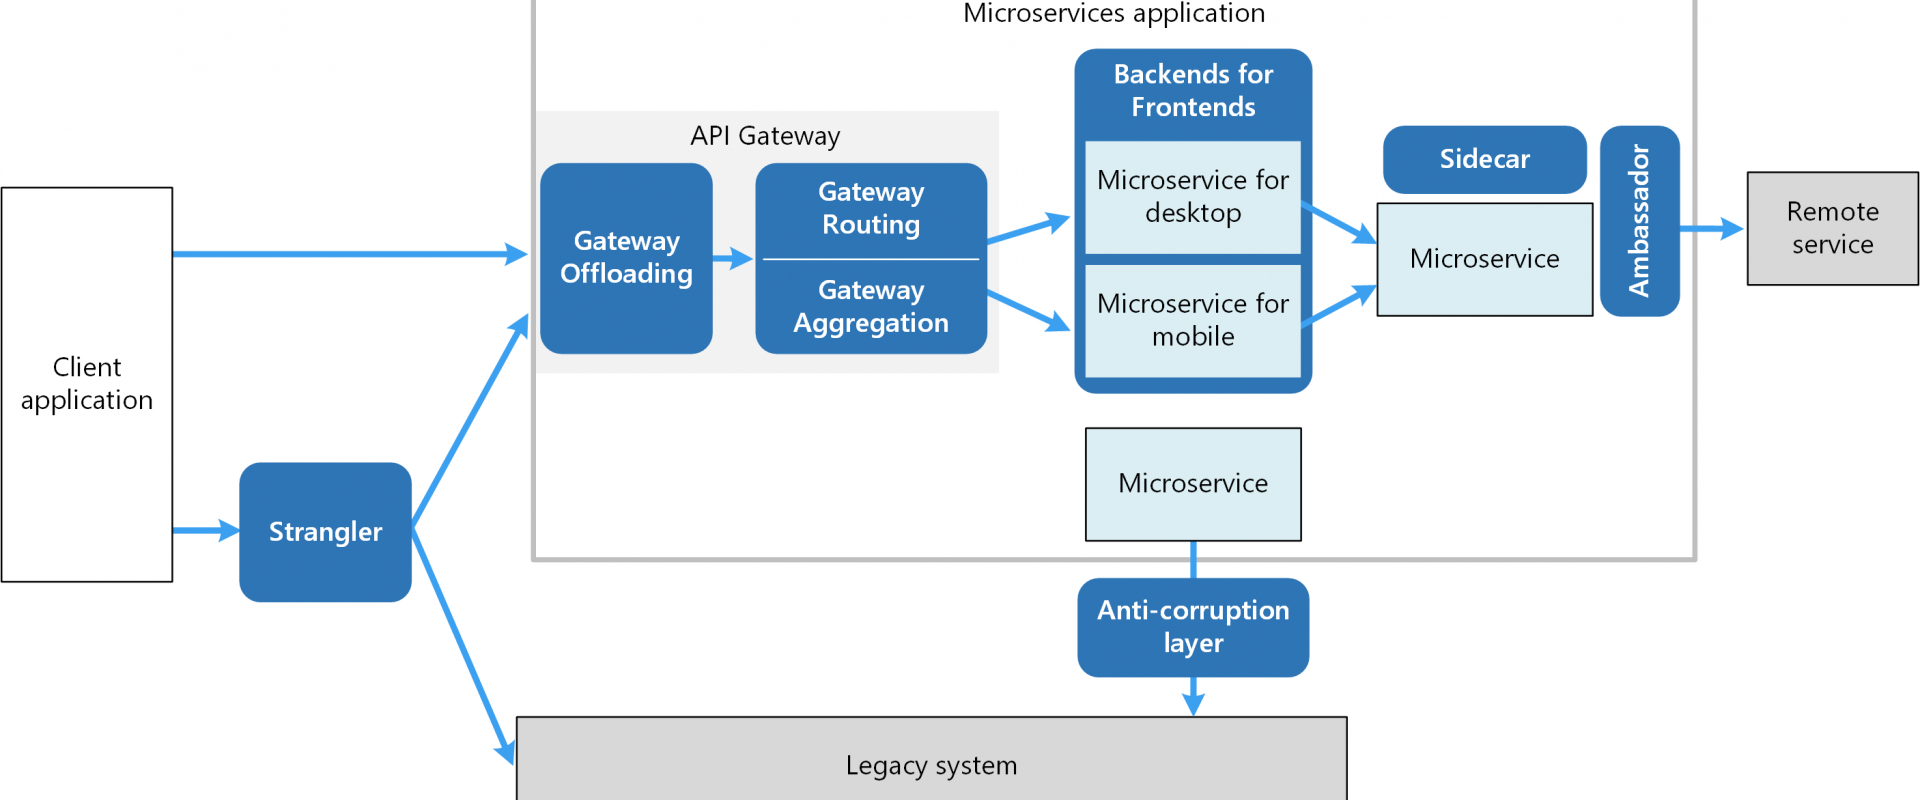
Microservices have an entirely new set of problems due to their distributed service-oriented architecture. As a result, microservice design patterns have surfaced. This post will consider the specific design patterns that can help us build reliable, secure, and traceable microservices.
Monitoring is fairly simple for a monolithic application. A few log statements here and there, and you can generally follow the life of a single request. However, when you have distributed applications, you are responsible for tracing many requests through many microservices, each potentially with its own identifiers and logging methodologies. So, we need a design pattern and some tools to help us trace the life of a request, from the cradle to the grave.
We’ll consider patterns to help with the following areas:
- Reliability
- Monitoring
- Security
Along the way, I will show how Kong Gateway - Kong is an open-source API Gateway and microservices management layer - and Kuma can help with implementing those patterns. Let’s touch briefly on these two tools.
Kong Gateway (API Gateway Microservice Design Pattern)
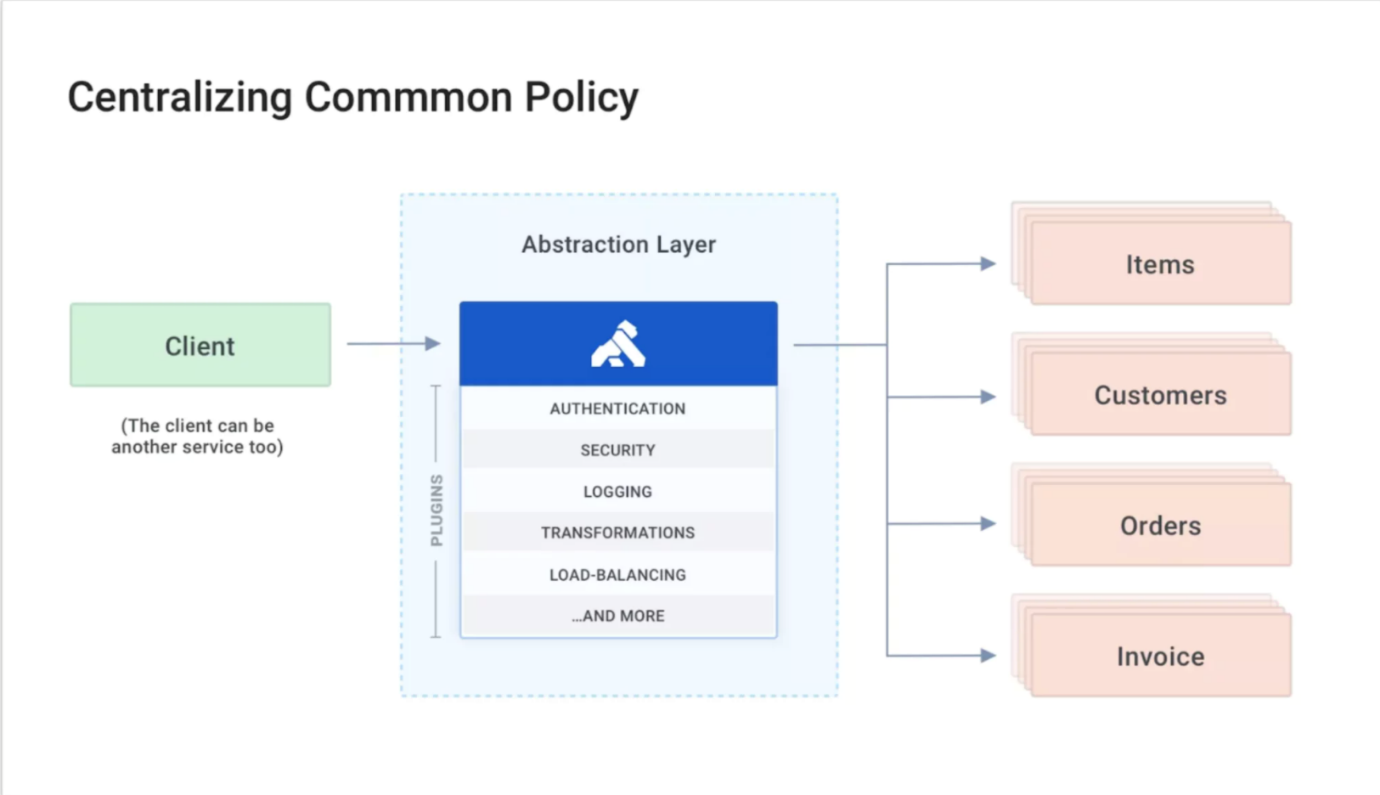
Kong Gateway is an API gateway that stands in front of your API services and provides additional functionality on top of those services. Think of load balancing, token verification, rate limiting, and other concerns that you, as the API developer, are responsible for but don’t necessarily want to be responsible for building and maintaining. Kong Gateway handles all these policies for you from a centralized location.

Kuma or Kong Mesh (Service-to-Service Microservice Design
Pattern)
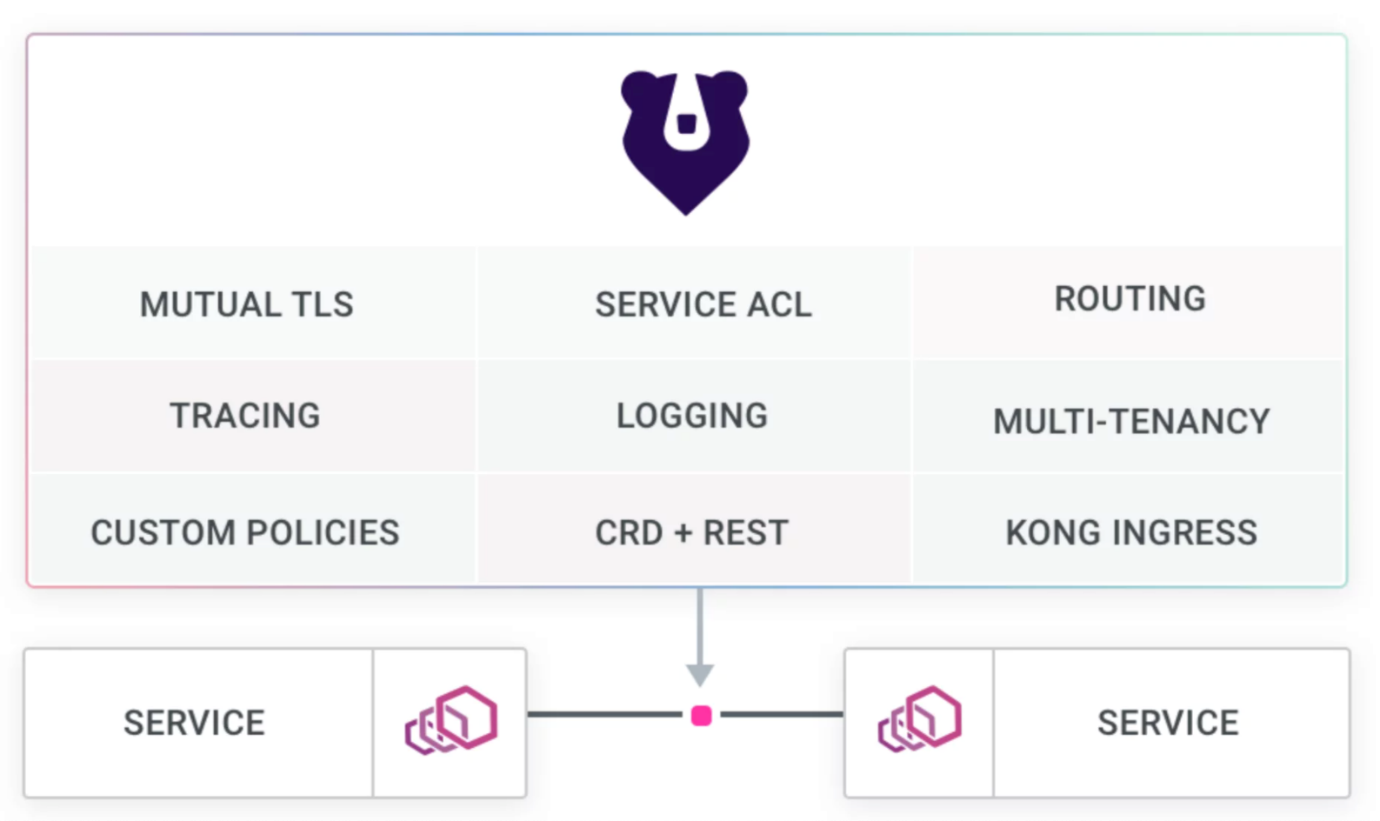
Kuma is a service mesh that routes data between your internal services, secures internal traffic, and provides service discovery. You may also want to consider Kong Mesh, the enterprise service mesh built on top of Kuma and Envoy.

Reliability
We live in a cloud computing and microservices world. It’s no longer sufficient to simply check that a single server is running and our application process is still alive. We need to implement more advanced techniques like circuit breakers and health checks.
1. Circuit Breakers
One microservices pattern for reliability is circuit breakers, which analyze the live traffic to service to verify if the service responds to requests appropriately. This may mean checking for certain status codes or responses that occur within a specific amount of time. If one replica instance of a service is unhealthy, it will be removed, and other instances will be responsible for fulfilling requests. With this design pattern, we passively check if a service is available. When it begins to fail to respond to requests, then we know it is unavailable.
Circuit breakers not only make sense in your service mesh, but you can take advantage of them all the way up to Kong Gateway. Kong Gateway will create a ring-balancer for your upstream entities, and as soon as an unhealthy instance is detected, Kong Gateway will remove that instance from the ring until it is healthy again.
There is another measure for ensuring reliability, but it comes at a cost.
2. Health Checks
Health checks are exactly what they sound like. We need to verify that service instances are ready to handle requests. Kong Gateway implements this by actively sending a request to each instance of a microservice to determine if that service can handle the request. If an instance doesn’t satisfy the health check, it will be removed from the service until it becomes healthy again. Meanwhile, requests will be routed to other healthy instances. These active requests are outstanding for determining uptime, but they do generate additional load on the network and the instances. This extra load is unacceptable in some environments, so we should use circuit breakers instead.
So, we now have two ways to check our services. We use health checks if we can afford the network load and want to know immediately if an instance is failing. We can use circuit breakers if the network load is too much, and we can accept a few failed live requests.
Kong Gateway deals specifically with ingress traffic to our application. What about traffic between multiple microservices? This is in the Kuma/Kong Mesh domain. Everything we’ve discussed still applies to our service mesh. Kuma still tracks the health of all the internal services within its service mesh and will reroute traffic if any instances fail the health check or trip the circuit breaker.
3. Service Discovery
The final piece in ensuring reliability involves service discovery within our service mesh. One of the benefits of using a service mesh such as Kuma is the ease of communication between our services, no matter the topology of our network.
Imagine that we deployed some services to GCP, others to AWS, and still others that are within our own private data center. It might be difficult to teach services how to communicate, especially when services can move or scale on the fly. For this, we rely on our service mesh to keep track. Services never need to keep track of all the running instances of a service, when they scale up or down or become healthy or unhealthy. Kuma will do all of this for us and send our traffic to a healthy instance without us ever having to change an address. To the operator and the end-user, the swapping in or out of a service instance or the changing of a network address are all transparent operations.
Monitoring
Now that our services are resilient to some failures, we need to monitor those services. As mentioned earlier, monitoring microservices is much more complicated than monolithic applications. In a monolithic application, all of our logs are in one place. We can inspect the logs from a single dashboard and use a single id to troubleshoot an issue. In the microservice world, we need to track a single request across multiple services. For this, we need a distributed tracing. Both Kong Gateway and Kuma have facilities to help us in this area.
Kong Gateway boasts an extensive library of plugins that span all concerns, and tracing is no exception. It supports adding a Zipkin plugin for capturing distributed traces. The architecture for Zipkin is based on augmenting requests to add distributed trace ids and span ids, thereby capturing the entire request, including any sub-requests that have occurred.
Kuma doesn’t need a plugin to deliver request traces; rather, it has two supported tracing collectors that you can configure. The first is Zipkin, and the second is Datadog. However, what does it actually mean to add tracing?
4. Distributed Tracing
Imagine that a request enters your system. The API gateway generates a request id and span id. Every request that originates from that request (meaning, any other microservices called through this request) will also contain that request the id and span id as they travel through your service mesh. Finally, all those traces will be sent to a trace aggregator of your choice so that you can dig into specific requests later.
In addition to surfacing errors, tracing can also bring slowdowns to light. Because of the distributed nature of microservices, tracking down the cause of a slow response can be incredibly difficult. Depending on if you are using asynchronous or synchronous calls to service a request, the user may not even notice that your services are running slowly—until it feels like something is completely broken—and that’s already too late. That’s why distributed tracing is extremely beneficial.
Finally, we can send the request the id back to the user. If the user needs to file a support ticket, you’ll have the exact information you need to track down the root cause of the user’s issue.
5. Logging
Understanding how a request progressed through our system is only part of the story. The request will first hit Kong Gateway, where we can use logging plugins to send the request and response to our logging system via HTTP, syslog, or by dropping it in a file. Next, the generated request-id and span id will be appended to the request as it heads over to our microservice via Kuma, which itself can keep a traffic log.
Finally, when the request arrives at our service, we can use contextual logging to write log files that append the request-id and span id to our local service log files. Though our logs are all over, the request we’re concerned with is tied across these sprawling logs through the request-id and span id.
As a quick example, if we use the syslog plugin for Kong Gateway and send our traffic to a Grafana Loki instance, we would simply configure Kuma to report its logs to Loki. Finally, we would ship all our local microservice logs to a single location. We can research a request from when it entered our system through Kong Gateway, traversing our service mesh Kuma and being serviced by any number of our microservices—all in a single dashboard!
Security
When we’re talking about microservices, there are a few types of security to deal with. First, let’s consider the security that everyone has seen: TLS (or that little lock icon in your browser’s location bar). The second is internal security. There are many ways to manage internal microservice security, and we’ll discuss two: micro-segmentation and internal traffic encrypted via mutual TLS (mTLS).
6. HTTPS/TLS
First, let’s discuss TLS. With Kong Gateway, you can add a free, auto-renewing Let’s Encrypt TLS certificate to Kong Gateway. The Kong Gateway plugin library will not let us down! All we need to do to set up for HTTPS/TLS is install and configure the ACME plugin. Now we can move on to internal security.
7. Micro-Segmentation
Some of our services just don’t need access to our other services, nor should they be given access. Micro-segmentation allows us to split our microservices into groups or segments.
We implement permissions to control which segments can speak to one another. For example, we may have a credit card processing service that stores sensitive data the API gateway or the outside world doesn’t even need to contact. Using Kuma for this micro-segmentation, we can prevent inappropriate communication at the network level, securing our sensitive data by only allowing authorized services to talk to our credit card service.
In Kuma, micro-segmentation is implemented as traffic permissions. We use tags to specify exactly which services (or groups of services) traffic is allowed to come from and to pinpoint where that traffic is allowed to go. Keep in mind that the default TrafficPermission that Kuma installs allows traffic from all services to all services. So, be sure to configure that policy first—potentially to disallow all traffic by default—depending on how strict you want your network traffic to be.
Next, let’s consider mTLS. Recall that TLS is only used to verify server identity when all clients can connect to that server. Think of a website. The clients need to verify the website before sending encrypted traffic to the server; however, the server allows all clients regardless of their identity. In contrast, mTLS verifies the identities of both endpoints before establishing an encrypted connection.
This makes a lot more sense in a service mesh, where the parties involved are peer services rather than servers and anonymous clients. In this case—and more specifically in the case of Kuma—mTLS is required for traffic permissions so that both endpoints can be validated before sending encrypted traffic between them.
Conclusion
This article looked at several patterns to make our microservices more reliable, traceable, and secure. More specifically, we considered how to use Kong Gateway and Kuma to implement health checks and circuit breakers to make our microservices more reliable.
Regarding monitoring, we looked at how to implement request tracing and centralized logging in microservices. Finally, we discussed implementing micro-segmentation via traffic permissions in Kuma and how Kuma can help encrypt/verify our traffic between services using mTLS.
Relevant Blogs:
Top 10 Infrastructure as Code (IaC) Tools
Split the Monolith: What, When, How
Observability for Monitoring Microservices: Top 5 Tools
Recent Comments
No comments
Leave a Comment
We will be happy to hear what you think about this post